STOCK CHARTS AND ANALYSIS – BLOOM
STOCK CHARTS AND ANALYSIS – BLOOM
This is in response to a Special Request made by one of our readers who calls himself “Napadapang Bloomer.” According to him he needs some exit plan with the least possible losses or just to recover capital. I think his sentiment reflects the sentiment of others who are also “IPIT” with this stock.
In accordance with our Independence Day commitment, following is our Technical Analysis of BLOOM (BLOOMBERRY RESORTS CORPORATION) as of January 22, 2016..
This is the SECOND OF THREE for FREE for this week. (FNI – Non-Index Stock and this one BLOOM – Index Stock) This is also the SEVENTH in OUR NINE IN THE EYES OF MINE (Five has been posted in our BooKAKA Premium Sentiment: DAVIN, SECB, 2GO, DMC and EEI) .
TA – TRT Way – Straight from the Chart
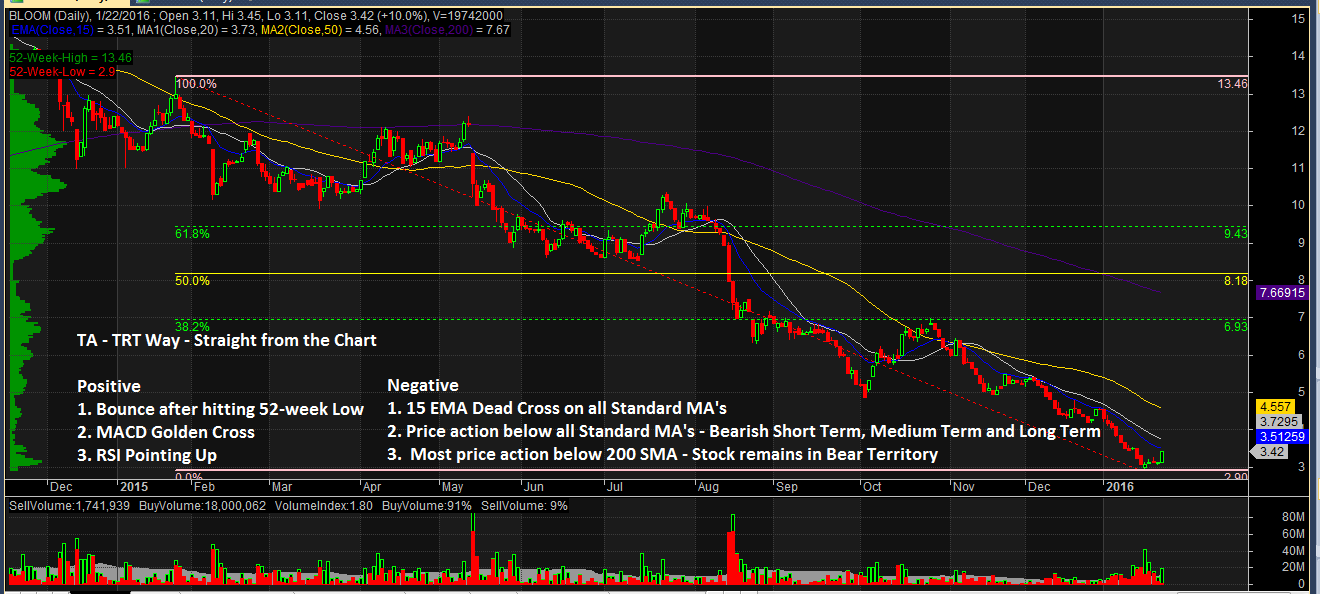
POSITIVE
1. Bounce after hitting 52-week Low. The stock seems to have bounced after hitting its 52-week low as evidenced by the green candles appearing lately.
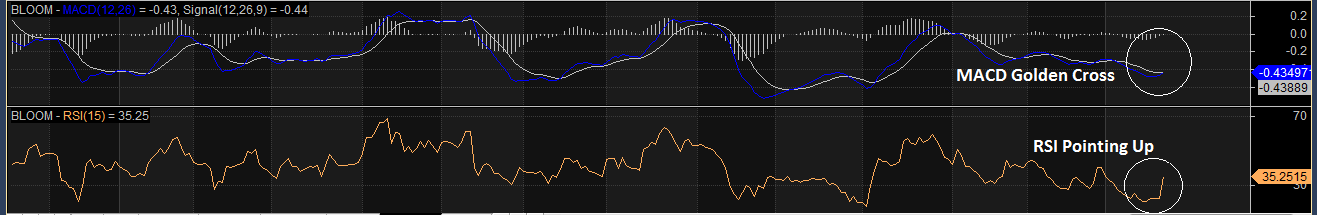 2. MACD Golden Cross. The evidence on the price chart is not conclusive so we have to find other evidence that supports the trade idea. Based on our review, the MACD has just made a Golden Cross and the Histogram below is decreasing showing a weakening of the Downtrend.
3. RSI Pointing Up. RSI is now pointing up which could be considered as supporting the bounce.
NEGATIVE
1. The 15 EMA has made a Dead Cross and remains below all our Standard MA’s giving a Sell Signal since November last year.
2. Price action below 15 EMA & 20 SMA, 50 SMA and 200 SMA shows that stock is Bearish Short Term, Medium Term and Long Term.
3. Most of the stock’s price action have been below the 200 SMA indicating that stock remains in Bear Territory.
With all the evidence considered it appears that the Bounce is just a Dead Cat Bounce. To prove otherwise BLOOM needs to break P6.93 (38.2% Fibo level)/
NOTES:
1. Responsible Trading is evidence-based trading so we are always looking for evidence that proves the existence of a LOW RISK, HIGH PROBABILITY TRADE. When we say POSITIVE this means positive evidence which supports the trade idea. NEGATIVE means otherwise. This may look different from the way other Technical Analysts make their presentation but we find it more appropriate so our readers can decide on their own and take full responsibility for their trading results.
2. On the opposite side of Pattern Targets are Pattern Failures. In case you decide to take this trade, always remember to set a stop loss based on your established risk tolerance level.
3. September is a very significant month for us. It was at the same time this year that we introduced Responsible Trading to mainstream social media. Starting September 1, 2015, since you are already familiar with our caption “TA – The Responsible Trader’s Way – No Hyping, No Bashing, Just Plain Cold Facts” we are changing this to TA – TRT Way – Straight from the Chart.
The Chart and Analysis is presented for educational purposes only and should NEVER BE TAKEN as a RECOMMENDATION to BUY, HOLD, or SELL.
Please trade with CAUTION, please trade with CARE. As always, IT’S YOUR TAKE, IT’S YOUR CALL. IT’S YOUR MONEY AFTER ALL.
Good luck on all your trades.