STOCK CHARTS AND ANALYSIS – DNL
STOCK CHARTS AND ANALYSIS – DNL
In accordance with our Independence Day commitment, following is our Technical Analysis of DNL
(D & L INDUSTRIES, INC.) as of July 2, 2015.
This is the third and completes our THREE for FREE for this week (MER – Index stock, TAPET – 3rd Liner, and this one DNL – 2nd Liner).
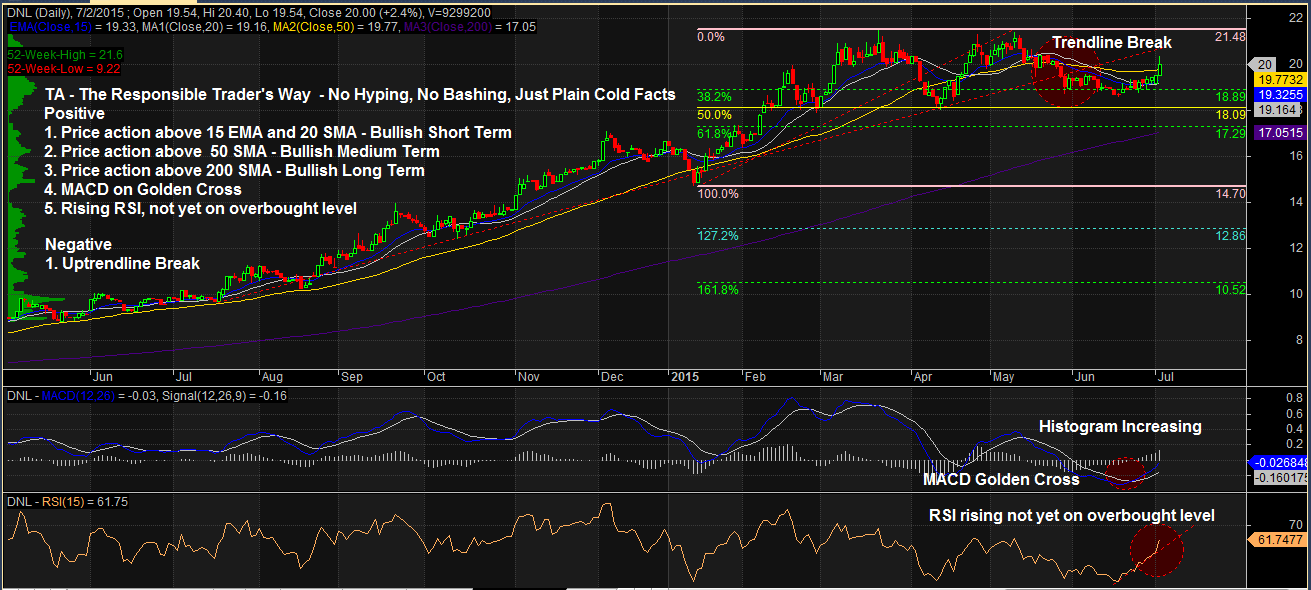
TA – The Responsible Trader’s Way – No Hyping, No Bashing Just Plain Cold Facts.
Positive
1. Price action above 15 EMA and 20 SMA. Bullish – Short Term. DNL’s current price action is now above 15 EMA and 20 SMA showing that the stock is Bullish on the Short Term. It is also worth noting that DNL managed to stay above 18.89 (38.2% Fibo level)
2. Price action above 50 SMA. Bullish – Medium Term. DNL’s current price action above 50 SMA shows that the stock is also Bullish on MediumTerm.
3. Price action above 200 SMA. Bullish –Long Term. DNL’s current price action above 200 SMA shows that the stock is also Bullish on Long Term.
4. MACD on Golden Cross. The MACD although still below the zero line has made a Golden Cross showing increasing strength of the trend. The Histogram is also increasing.
5. Rising RSI. The rising RSI further confirms the strength of the trend and it is still below overbought level.
Negative
1. Trendline Break. In spite of all the positive things going for DNL it still has to struggle to resume its uptrendline.
NOTE: Positive points are things that could work in your favor. Negative points are things that you have to watch out for.
The Chart and Analysis is presented for educational purposes only and should NEVER BE TAKEN as a RECOMMENDATION to BUY, HOLD, or SELL.
Please trade with CAUTION, please trade with CARE. As always, IT’S YOUR TAKE, IT’S YOUR CALL. IT’S YOUR MONEY AFTER ALL.
Good luck on all your trades.