STOCK CHARTS AND ANALYSIS – DNL
STOCK CHARTS AND ANALYSIS – DNL
In accordance with our Independence Day commitment, following is our Technical Analysis of DNL (D&L INDUSTRIES, INC.) as of August 7, 2015.
This is the first of our THREE for FREE for this week.
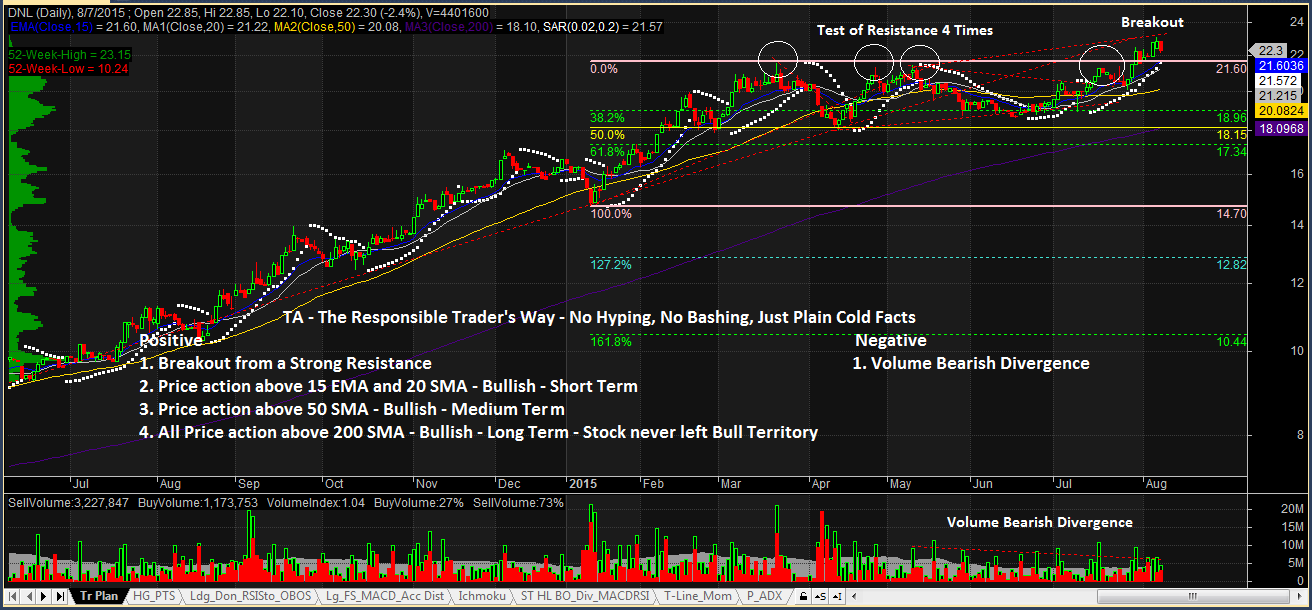
TA – The Responsible Trader’s Way – No Hyping, No Bashing, Just Plain Cold Facts.
Positive
1. Breakout from a Strong Resistance. After testing the P21.60 Resistance level four times, DNL has finally made a breakout.
2. Price action above 15 EMA and 20 SMA – Bullish – Short Term. Price action above 15 EMA and 20 SMA shows that the stock in Bullish on the Short Term.
3. Price action 50 SMA – Bullish – Medium Term. Price action way above 50 SMA shows that the stock is Bullish on the Medium Term.
4. All price action above 200 SMA – Stock in Bull territory. Even with the sideways consolidation, the stock has remained above the 200 SMA showing the stock has never left the Bull territory.
Negative
1. Volume Bearish Divergence. Although the stock has made a new Higher High, Volume did not seem to behave the same way. As can be seen from the Chart, Volume has been relatively flat during the early part of May up to the present. Aside from this, we have not seen any other weaknesses in DNL’s Technical Structure.
NOTES:
1. Positive points are things that could work in your favor. Negative points are things that you have to watch out for.
2. On the opposite side of Pattern Targets are Pattern Failures. In case you decide to take this trade, always remember to set a stop loss based on your established risk tolerance level.
The Chart and Analysis is presented for educational purposes only and should NEVER BE TAKEN as a RECOMMENDATION to BUY, HOLD, or SELL.
Please trade with CAUTION, please trade with CARE. As always, IT’S YOUR TAKE, IT’S YOUR CALL. IT’S YOUR MONEY AFTER ALL.
Good luck on all your trades.