STOCK CHARTS AND ANALYSIS – ION
STOCK CHARTS AND ANALYSIS – ION
In accordance with our Independence Day commitment, following is our Technical Analysis of ION (IONICS, INC. ) as of Sept. 24, 2015.
This completes our THREE for FREE for this week. (GTCAP – Index Stock, SPH – Non-Index Stock and this one ION – Non-Index Stock).
TA – TRT Way – Straight from the Chart
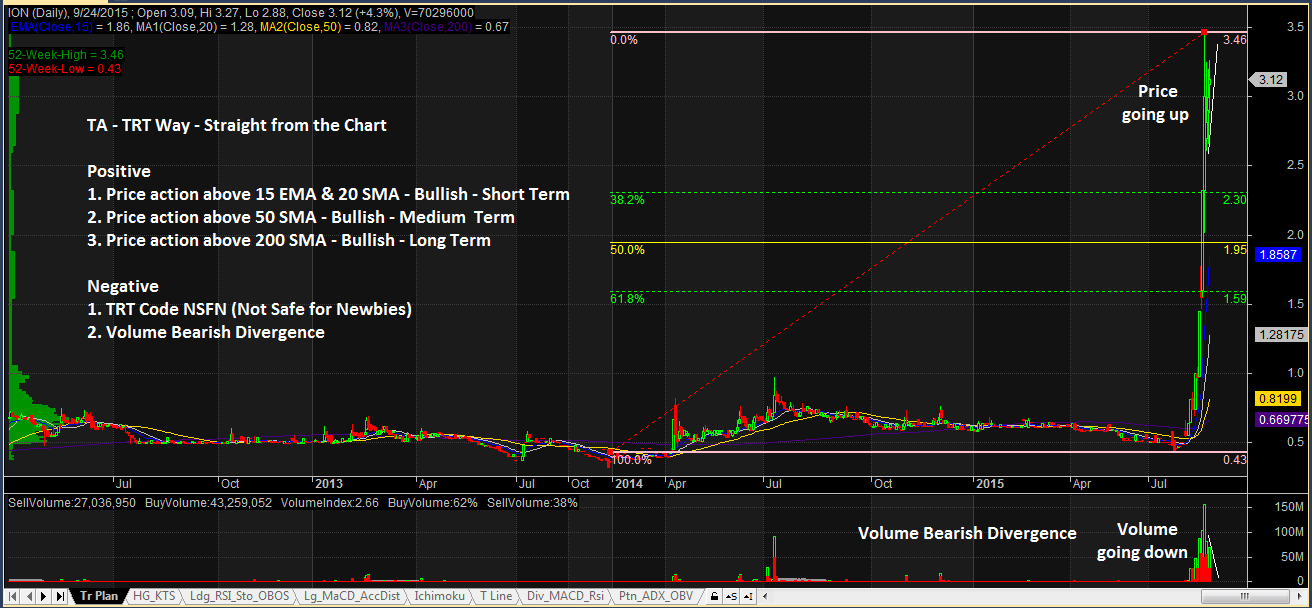
POSITIVE
1. Price action above 15 EMA and 20 SMA – Bullish – Short Term. Price action above 15 EMA and 20 SMA shows that the stock is Bullish on the Short Term.
2. Price action above 50 SMA – Bullish – Medium Term. Price action above 50 SMA shows that the stock is Bullish on the Medium Term
3. Price action above 200 SMA – Bullish Long Term. The stock’s price action above 200 SMA confirms that the stock is in Bull territory.
NEGATIVE
1. TRT Code NSFN (Not Safe for Newbies) Inspite of all the Positive Points indicated above we have to put our stamp TRT Code NSFN. The stock has gone up so fast and furious and buying at this point would mean buying at the highs so the stock is no longer safe for newbies.
2. Volume Bearish Divergence. While price is again trying to go back to it’s 52-week high of P3.46, volume is moving in the opposite direction. Volume does not seem to support the price move and could result in a pullback soon.
NOTES: (FOR THOSE WHO CANNOT REALLY RESIST TRADING THIS STOCK AT THIS LEVEL)
1. Please be sure you and your stockbroker have a stable internet connection. The Internet providers have a nasty habit of going offline whenever you need them to escape from a bad position.
2. Please be sure you can monitor the stock closely. Prices can change abruptly in a split second so you should be able to make split-second decisions.
3. Please be sure you do not have a bladder problem and you don’t get excited by volatile price movements.
4. Please be sure you do not have any heart condition.
NOTES:
1. Positive points are things that could work in your favor. Negative points are things that you have to watch out for.
2. On the opposite side of Pattern Targets are Pattern Failures. In case you decide to take this trade, always remember to set a stop loss based on your established risk tolerance level.
3. September is a very significant month for us. It was at the same time this year that we introduced Responsible Trading to mainstream social media. Starting September 1, 2015, since you are already familiar with our caption “TA – The Responsible Trader’s Way – No Hyping, No Bashing, Just Plain Cold Facts” we are changing this to TA – TRT Way – Straight from the Chart.
The Chart and Analysis is presented for educational purposes only and should NEVER BE TAKEN as a RECOMMENDATION to BUY, HOLD, or SELL.
Please trade with CAUTION, please trade with CARE. As always, IT’S YOUR TAKE, IT’S YOUR CALL. IT’S YOUR MONEY AFTER ALL.
Good luck on all your trades.