STOCK CHARTS AND ANALYSIS – MCP
STOCK CHARTS AND ANALYSIS – MCP
In accordance with our Independence Day commitment, following is our Technical Analysis of MCP (MELCO CROWN (PHILS.) RESORTS) as of August 3, 2015.
This is the second of our THREE for FREE for this week.
TA – The Responsible Trader’s Way – No Hyping, No Bashing, Just Plain Cold Facts.
Positive
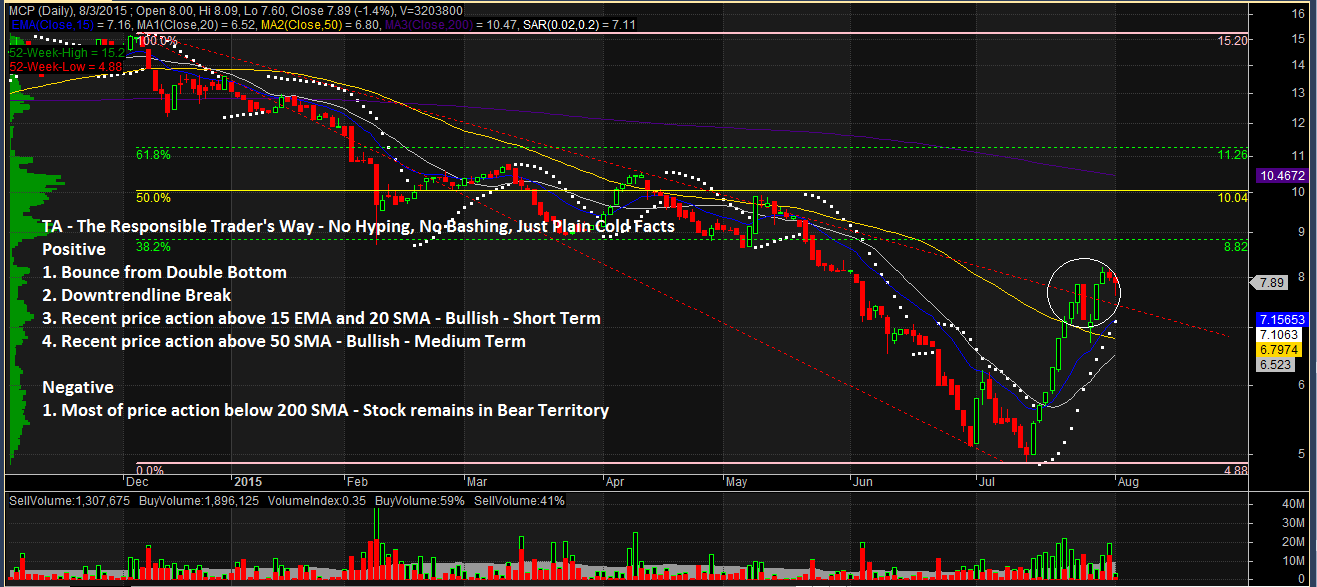
1. Bounce from a Double Bottom. After a long period of being on a Downtrend, MCP appears to have bounced after hitting a Double Bottom Chart Pattern.
2. Downtrendline break. Coupled with the bounce, MCP appears to have broken out from its Downtendline. A break of P8.82 (38.2% Fibo Resistance) with volume would serve as confirmation.
3. Price action above 15 EMA and 20 SMA – Bullish – Short Term. Recent Price action that is above 15 EMA and 20 SMA shows that the stock is Bullish on the Short Term.
4. Price action above 50 SMA – Bullish – Medium Term. Recent Price action that is also above 50 SMA shows that the stock is also Bullish on The Medium Term.
Negative
1. Inspite of all the positive points cited above, most of MCP’s price actions are still below the 200 SMA showing that the stock remains in Bear territory.
NOTES:
1. Positive points are things that could work in your favor. Negative points are things that you have to watch out for.
The Chart and Analysis is presented for educational purposes only and should NEVER BE TAKEN as a RECOMMENDATION to BUY, HOLD, or SELL.
Please trade with CAUTION, please trade with CARE. As always, IT’S YOUR TAKE, IT’S YOUR CALL. IT’S YOUR MONEY AFTER ALL.
Good luck on all your trades.