TRT ICHI-MONICS – THE PERFECT GARTLEY PATTERN
THE PERFECT GARTLEY PATTERN
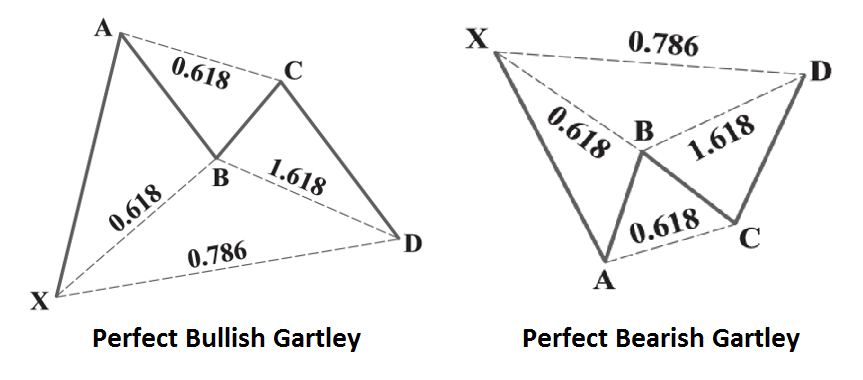
Note: images taken from the books on Harmonic Trading by Scott Carney
The Perfect Gartley Pattern has all the features of the Gartley Pattern except for the following:
a. Exact 61.8% retracement of the B point. . You will recall from our last lesson that the B point retracement for the Gartley is a range from 38.2% up to 88.6%. The exact retracement at 61.8% differentiates the Perfect Gartley Pattern from the Gartley Pattern.
b. Exact 161.8% BC Projection. In the Gartley Pattern, the BC Projection is a range from 113.0% to 161.8%. The exact 161.8% BC extension differentiates the Perfect Gartley Pattern from the Gartley Pattern.
Let us draw the Pattern using the following procedures:
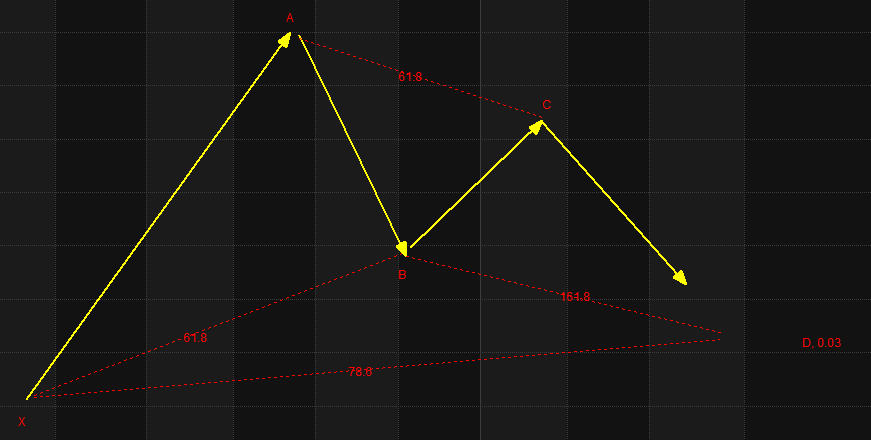
1. Draw a Fibonacci Retracement Grid starting from point X to point A to get where point B retraced. In this case it is at 61.8%.
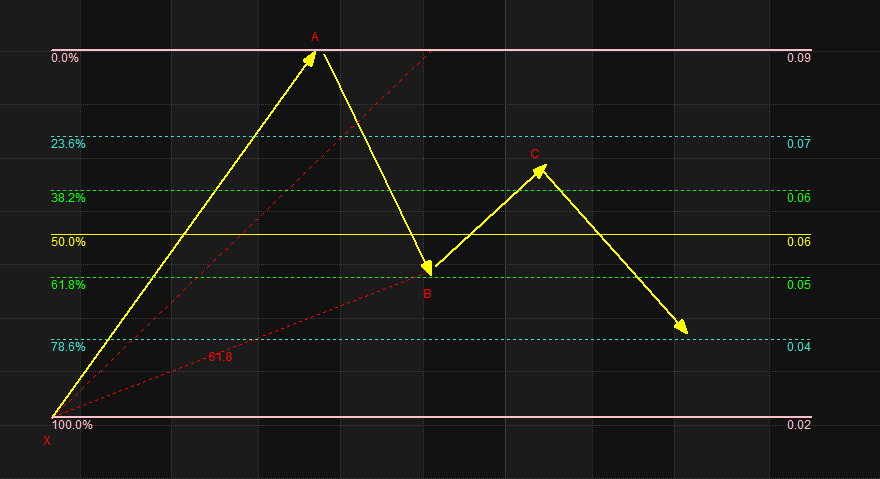
2. Draw a Fibonacci Retracement Grid starting from point A to point B to get where point C retraced. In this case it is 61.8%.

3. Project BC by drawing a Fibonacci Extension from C to B using C as Point of Origin and Point of Termination. From the Perfect Bullish Gartley image this should be an exact i 161.8%. We see 0.03 where 161.8% is. We mark this as our tentative point D or PRZ.
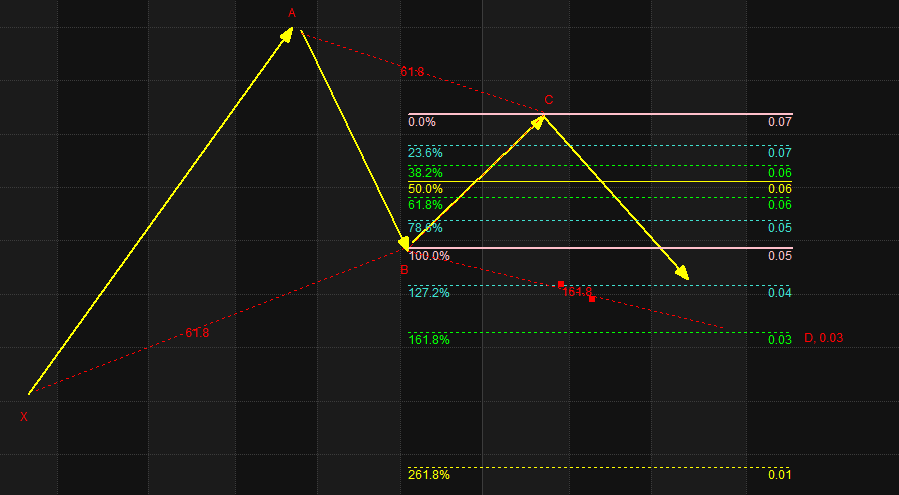
4. The next step is to draw the Constraint which is a 78.6% Retracement of the XA leg. We see that this 78.6% Retracement falls also at 0.03 and further validates the same point obtained thru the 1.618 extension of the BC leg. This constraint is the final requirement for determining where point D or the PRZ lies.
I have maintained the same yellow lines we used when we discussed about the Gartley Pattern. You will recall that our Point D in that Pattern is at 0.04. Do you know why?
In the last lesson, we had a 50.0% retracement at Point C. This time we have a 61.8% retracement at Point C. The higher retracement resulted in a deeper BC Projection of 0.03 at point D.
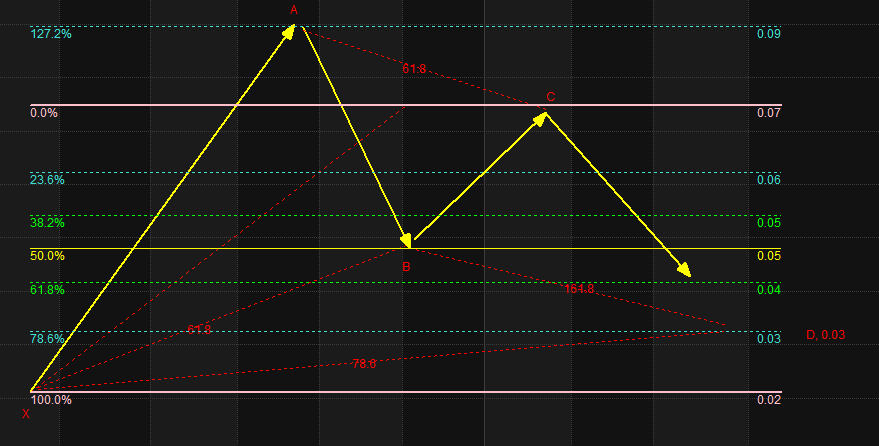
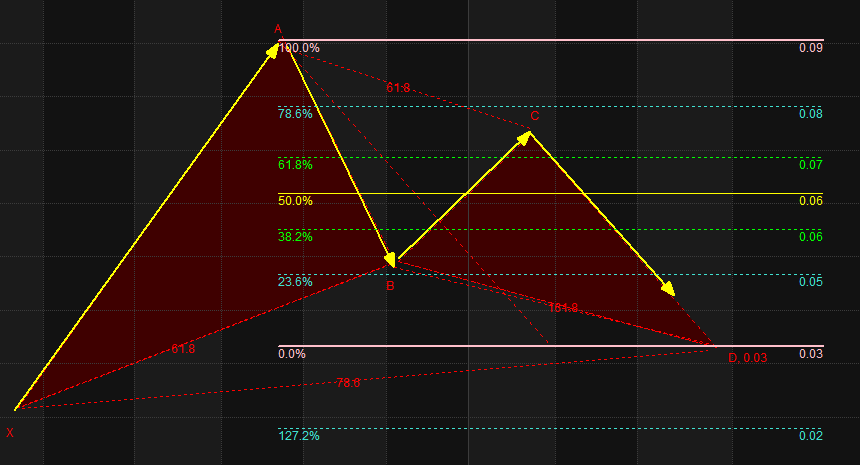
5. This figure shows the Pattern with the corresponding Fibonacci measurements.
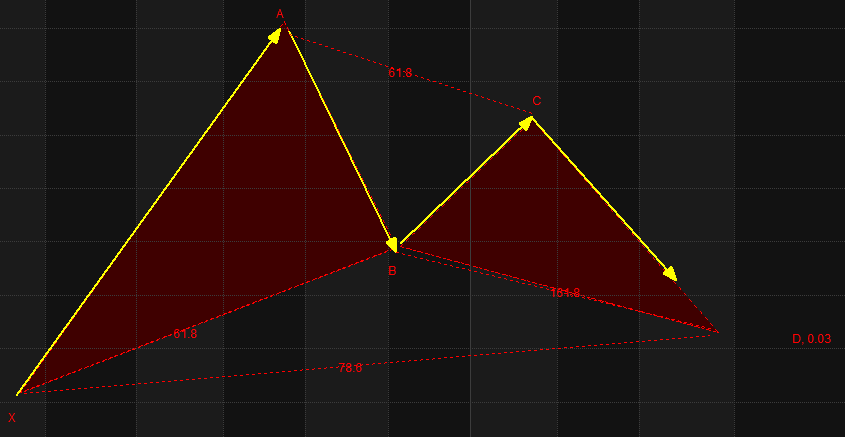
6. We now draw the Pattern by connecting the points of the two Triangles. This is the complete Perfect Bullish Gartley Pattern.
7. Just like in our last lesson, to make the pattern useful, we have to draw a final Fibonacci Retracement Gridline starting from Point A to Point D to establish our TRT Critical Action Zones.
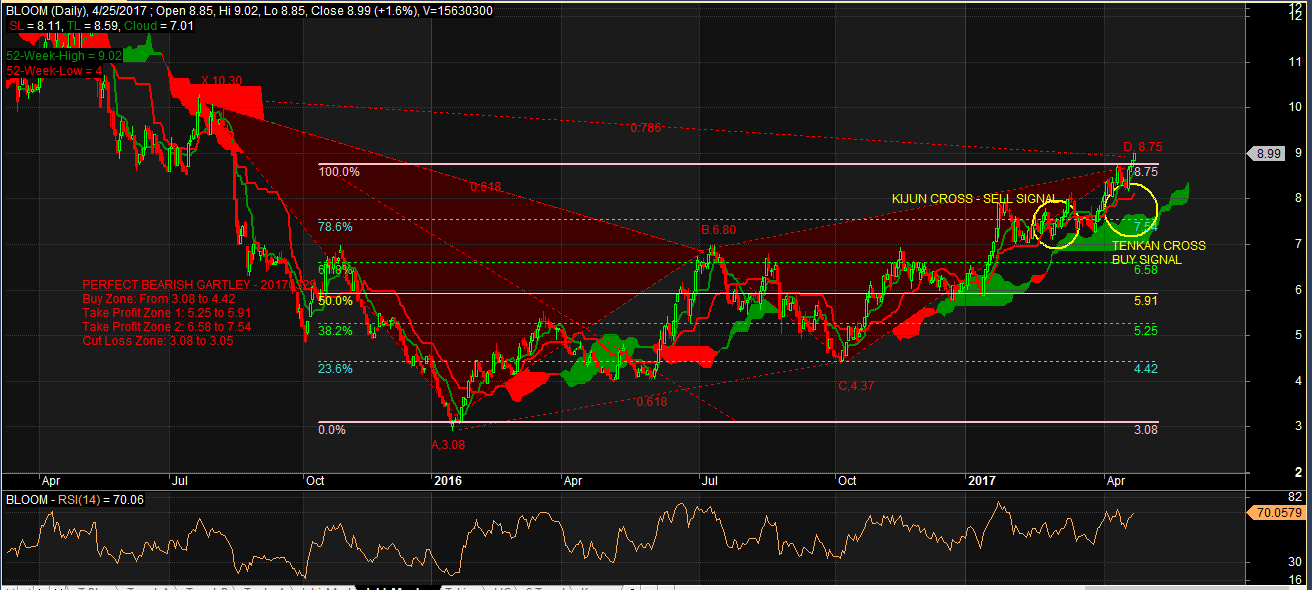
To better appreciate the Pattern, I would like us to take a look at some examples. Howevever, I cannot seem to find an example for the Perfect Bullish Gartley. This one is BLOOM with a Perfect Bearish Gartley Pattern.
NOTE: Sometimes some figures appear as decimals. At other times they appear as percentages. To convert decimals to percentage just move the decimal point two places to the right. For example 1.618 is expressed in percentage as 161.8%.
“TRT Ichi-Monics – The Trading Signals of Ichi Moku Kinko Hyo and the Trading Parameters of Harmonics”
NOTE: This is a trading lesson previously posted in my BooKAKA Premium. Subscribers get these lessons weekly. It is posted here so that BooKAKA Premium Subscribers can review them again and for others to see what they are missing from my posts in my BooKAKA Premium.
Next Lesson: THE BAT PATTERN