STOCK CHARTS AND ANALYSIS – CPG
STOCK CHARTS AND ANALYSIS – CPG
In accordance with our Independence Day commitment, following is our Technical Analysis of CPG (CENTURY PROPERTIES GROUP, INC.) as of July 16, 2015.
This is the third and completes our THREE for FREE for this week (X – 2nd Liner, BLOOM – Index Stock) and this one CPG – 3rd Liner.
TA – The Responsible Trader’s Way – No Hyping, No Bashing Just Plain Cold Facts.
Positive
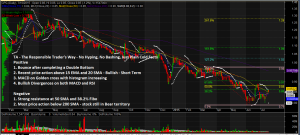
1, Bounce after completing a Double Bottom Pattern. After a long downtrend, CPG appears to be bouncing after completing a Double Bottom Chart Pattern.
2, Recent price action above 15 EMA and 20 SMA – Bullish – Short Term. CPG’s recent price action is above 15 EMA and 20 SMA showing that the stock is Bullish on the Short Term.
Responsible trading is evidence-based trading so we will try to present more evidence to support the positive side.
3. MACD on Golden Cross. The MACD has just made a Golden cross and histogram is increasing.
4, Bullish Divergences on both MACD and RSI. Before the bounce, the MACD and RSI both showed Bullish Divergences indicating a probable change in trend direction.
Negative
1. Strong resistance at 50 SMA and 38.2% Fibo. The 50 SMA together with 38.2% Fibo are both acting as strong Resistance. The stock needs to take these out strongly with volume to confirm the change in trend direction.
2. Most of the price action are below the 200 SMA showing that the stock is still in Bear territory.
NOTE: Positive points are things that could work in your favor. Negative points are things that you have to watch out for.
The Chart and Analysis is presented for educational purposes only and should NEVER BE TAKEN as a RECOMMENDATION to BUY, HOLD, or SELL.
Please trade with CAUTION, please trade with CARE. As always, IT’S YOUR TAKE, IT’S YOUR CALL. IT’S YOUR MONEY AFTER ALL.
Good luck on all your trades


