STOCK CHARTS AND ANALYSIS – DNL
STOCK CHARTS AND ANALYSIS – DNL
In accordance with our Independence Day commitment, following is our Technical Analysis of DNL (D&L INDUSTRIES, INC) as of Oct. 22, 2015.
This is the first of our THREE for FREE for this week
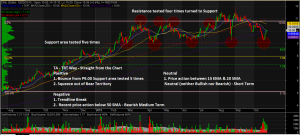
We usually change our Fibonacci settings based on the 52-Week High and Low to have a very good idea of the stock’s price action on a long term basis. In the case of DNL, however, we are retaining our previous Fibo settings since we find the P10.80 level very significant (this is Resistance tested 4 times and then turned to Support). We were expecting that a break of this strong Support would cause a waterfall and send the stock to its next Fibo support of P8.63 but it has not happened yet.
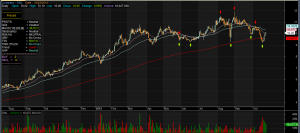
This stock has baffled a lot of Technical Analysts so we are using another tool (which we also use as one our TRT Screeners) the Holy Grail developed by a certain Prasad to help us monitor its price movements. Everytime we see a Buy or Sell generated, we share it to our readers in BooKAKA (www.bookaka.com).
It’s time to proceed to our Technical analysis.
TA – TRT Way – Straight from the Chart
POSITIVE
1. Bounce from P9.00. We consider P9.00 as a critical support before hitting P8.63 (38.2% Fibo). You will notice that this area has been tested 5 times so it serves as strong support.
2. Squeeze out of Bear Territory. Although most of the stock’s price action have been above the 200 SMA, the last five days have seen the stock falling below the 200 SMA indicating that the stock has entered the Bear Territory. Last October 21st price action was a squeeze out of Bear Territory and it needs to to take back P10.80 to confirm that it has indeed resumed its uptrend.
NEGATIVE
1. Trendline Break. The stock has broken its uptrendline and had exhibited structural technical weaknesses ever since.
2. Recent price action below 50 SMA – Bearish – Medium Term. The stock’s recent price action below 50 SMA shows that it is Bearish on the Medium Term.
NEUTRAL
1. Price action between 15 EMA & 20 SMA – Neutral – Short Term. Alhough the stock has bounced after hitting the P9.00 area price action so far had been between 15 EMA & 20 SMA showing that the stock is Neutral (neither Bullish nor Bearish) on the Short Term.
THE HOLY GRAIL AS CONTRARIAN ON THIS STOCK.
As I previously stated, we use the Holy Grail to further validate our observations. The Holy Grail seems to be a Contrarian on this stock. Almost all Charts of DNL we have seen so far are Bearish on this stock. However, as can be seen from this Chart, the Holy Grail issued a Buy Signal last October 20, 2015 pointing to the candlestick of October 16. 2015.
NOTES:
1. Positive points are things that could work in your favor. Negative points are things that you have to watch out for.
2. On the opposite side of Pattern Targets are Pattern Failures. In case you decide to take this trade, always remember to set a stop loss based on your established risk tolerance level.
3. September is a very significant month for us. It was at the same time this year that we introduced Responsible Trading to mainstream social media. Starting September 1, 2015, since you are already familiar with our caption “TA – The Responsible Trader’s Way – No Hyping, No Bashing, Just Plain Cold Facts” we are changing this to TA – TRT Way – Straight from the Chart.
4. Before using our TRT Screeners (One of them is the Holy Grail) please visit my Profile in BooKAKA and read TRT SCREENERS – 5 GUIDELINES.
The Chart and Analysis is presented for educational purposes only and should NEVER BE TAKEN as a RECOMMENDATION to BUY, HOLD, or SELL.
Please trade with CAUTION, please trade with CARE. As always, IT’S YOUR TAKE, IT’S YOUR CALL. IT’S YOUR MONEY AFTER ALL.
Good luck on all your trades.


