PSE Index 2017 – Best and Worst Case Scenarios
PSE Index 2017 – Best and Worst Case Scenarios
The year 2017 is going to be a MAKE or BREAK Year. Are you ready for 2017?
We are all familiar with the Fundamental backdrop we, as traders/investors are going to operate in the Philippine stock market this year:
1. The Federal Reserve’s raising of interest rates. . This could threaten emerging markets like the Philippines and trigger more Foreign Selling as it becomes more profitable to invest abroad.
2. The effect of Trump’s Presidency. Trump is very vocal about his “America First Policy” and this could adversely affect revenue from the BPO Sector and the companies providing the related goods and services.
3. President Duterte’s preferential trade and economic relations with China and Russia and his disdain for U.S. Foreign aid.
4. Rise in inflation rate due to OPEC member countries’ cut-down in oil production resulting in increasing oil prices and price of commodities.
5. Decline of the value of the peso vis-à-vis the US Dollar.
In order to obtain guidance on what to expect for 2017, let us take a look at some evidences on the Technical side. First the POSITIVES.
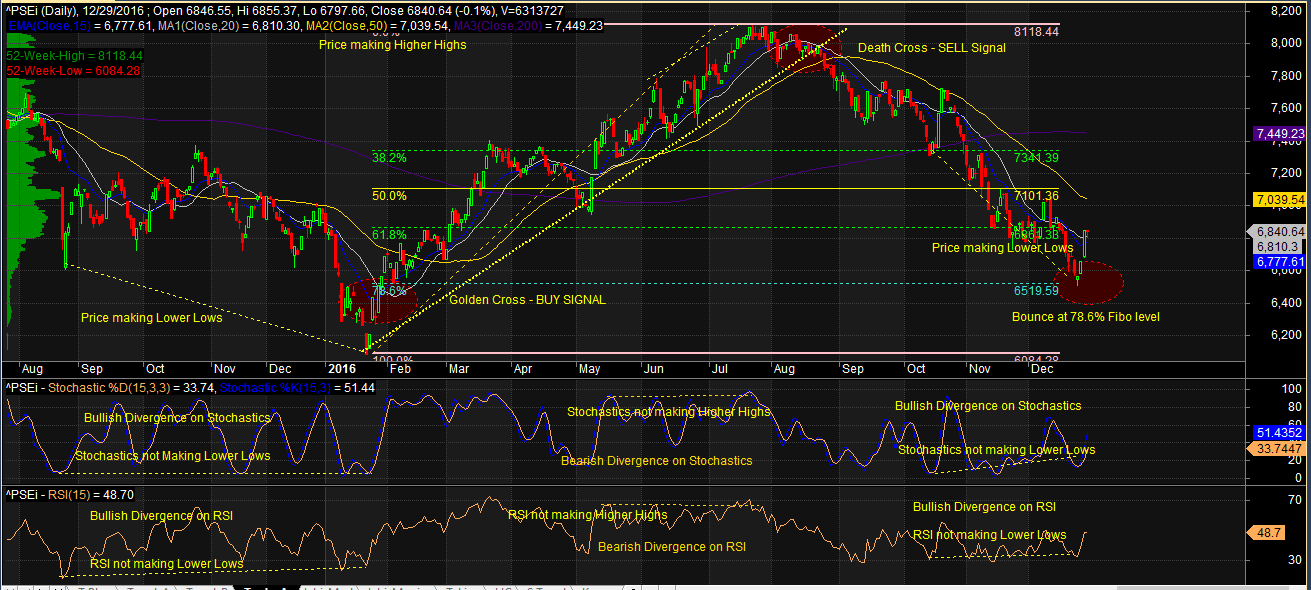
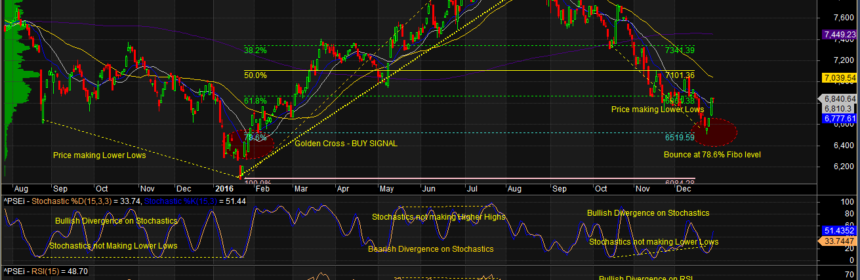
1. Bullish Divergences. During the 2nd week of October 2016, we can already see Bullish Divergences on both the Stochastics and the RSI. While price was making Lower Lows, the Stochastics and RSI did not follow suit.
Moving back to the later part of 2015, you will observe that the same Bullish Divergences also preceded the Uptrend which started during the early part of January 2016. In the same manner, Bearish Divergences also preceded the change in the same Uptrend during the year.
In our opinion, the Divergences have proven to be effective evidences for providing guidance on changes in Trend Direction.
2. Bounce at 78.6% Fibonacci Level. During the last three trading days of December 2016, the Index bounced at 6,519.59 at almost exactly the 78.6% Fibonacci level. This level is considered very significant by Technical Analysts when observing price action because it could either result in a resumption of the Uptrend or a confirmation of the Trend Breakdown.
Now the NEGATIVES:
1. Death Cross. There has already been a Death Cross on all our Standard Moving Averages – 15 EMA crossing below the 20 SMA, 50 SMA and the 200 SMA.
2. Bear Territory. Recent price action below the 200 SMA indicates that our Index has already entered the Bear Territory.
Taking all of these in consideration we arrive at the following probable scenarios:
Best Case Scenario
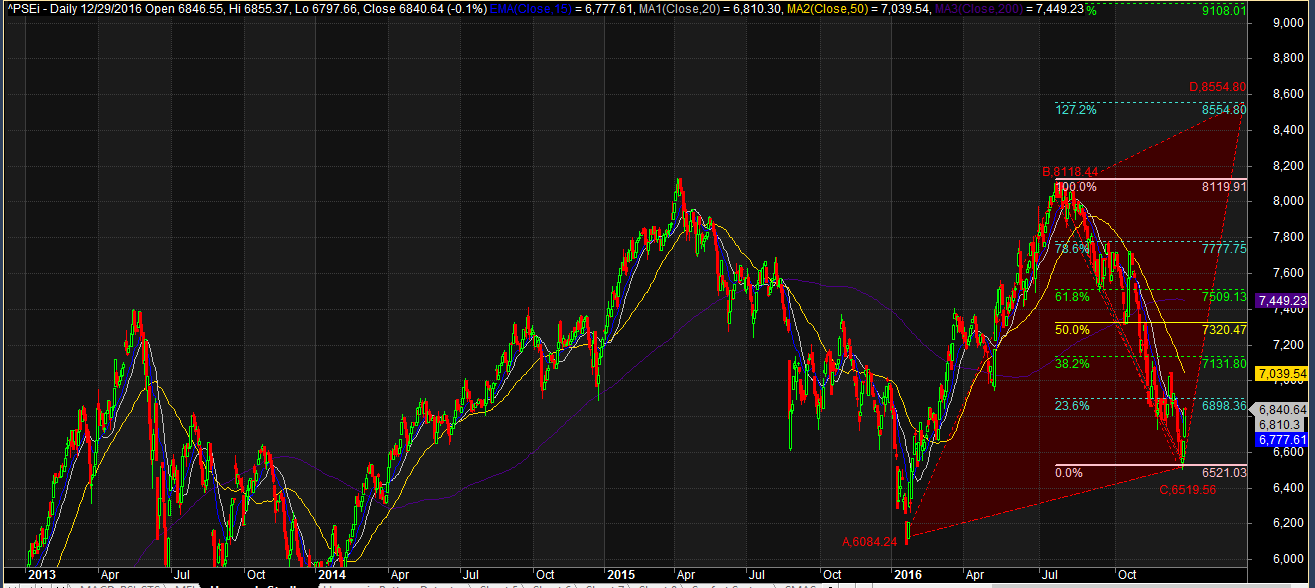
Based on the AB = CD Harmonics Pattern, this 78.6% Retracement from 8118.44 to 6519.56could result in a corresponding Fibonacci projection of 127.2% or 8554.80.
Worst Case Scenario

If the Index will not be able to hold 6519.59, this could send the Index to a 100% Retracement of 6084.28.
All of these scenarios are based on PROBABILITIES and NOT CERTAINTIES. However, awareness of these scenarios could enable us to better prepare for the challenges and opportunities we could face during the year.
We hope you gained something from the insight that we shared. We wish you a better trading year for 2017 and good luck on all your trades.
Thank you Sir Fred. =)
Hi Michael,
You’re welcome. I am glad you like it.
Best regards,
Fred
Thank you Sir! Very informative.
Hi Jay,
You’re welcome. I am glad you like it. Please feel free to look at other features of this website and visit my YouTube Channel http://www.youtube.com/theresponsbletrader to know more about Responsible Trading.