THE RESPONSIBLE TRADER – STOCK CHARTS AND ANALYSIS – IMPROVED PROCEDURES
THE RESPONSIBLE TRADER – STOCK CHARTS AND ANALYSIS PROCEDURES
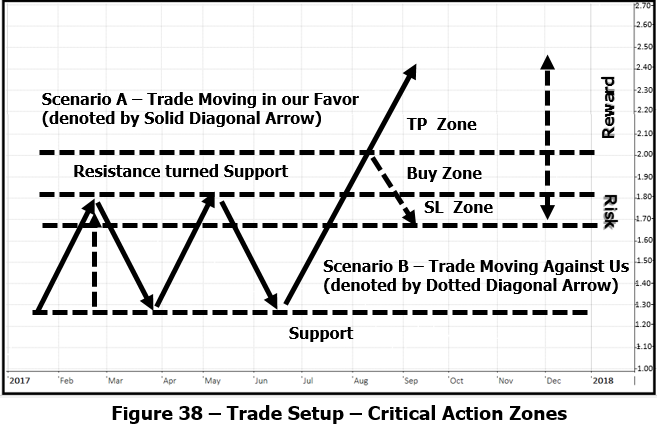
In my second book: “Swing Trading with TRT – A Definitive Guide for Trading the Philippine Stock Market”, I discussed about the TRT CAZ – The Critical Action Zones – The Buy, Target Price and Stop Loss Zones. In reading the TRT Charts, we will use the following as our Guide:
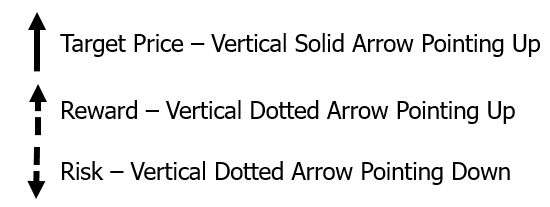
Also, in our presentation we will always consider two scenarios: Scenario A – Trade Moving in our Favor denoted by a Solid Diagonal Arrow and Scenario B – Trade Moving Against Us denoted by a Dotted Diagonal Arrow as indicated below. In addition, we will also indicate Risk as a Dotted Vertical Arrow Pointing Down and Reward as a Dotted Vertical Arrow Pointing Up as indicated below:
In doing our Stock Charts and Analysis, we will be using Five Questions:
- What is the present trend and how strong is the trend?
For this we draw a Trendline. For an Uptrend we connect all the Lows. For a Downtrend we connect all the Highs. To determine trend strength we use ADX and examine the Trendline for structural strength. The UpTrendline should have Higher Lows. The more the better and should not have any Trendline break or very few at all.
In addition we also examine the orientation of the Moving Averages. They should be on the Most Bullish Orientation.
- Based on our Trading Strategy Map, at what Phase is the Stock in?
This will help us determine the most appropriate Trading Strategy to be applied and the corresponding Indicators to be used.
- Is there any Chart Pattern that will serve as guide for establishing our Critical Action Zones?
For this we draw lines to determine significant Support and Resistance levels and see whether they run parallel or converge on certain points to form Chart Patterns. If there is a Chart Pattern we establish our Critical Action Areas and confirm our Trade Setup
- Does the Trade Setup offer sufficient Risk/Reward ratio?
Before proceeding any further, we have to examine whether the Trade Setup offers sufficient Risk/Reward ratio. No matter how good the Trade-Setup looks if there is none, there is no reason for us to take the trade.
- Do we see any Trading Signal?
This is the last part of the Analysis. For this we look for Moving Average Crossovers, Bullish Candlestick Patterns, Price Breaking out of Consolidation, Price Bouncing Off significant Support and Resistance levels and Divergences and confirmation from our Indicators.
After completing these, we present our findings and observations as Positive or Negative Evidence of a Low-Risk, High-Probability Trade.
Please bear this in mind so you can better appreciate the Stock Charts and Analysis that we will be sharing with you.
Good luck on all your trades.