STOCK CHARTS AND ANALYSIS – 2GO
STOCK CHARTS AND ANALYSIS – 2GO
In accordance with our Independence Day commitment, following is our Technical Analysis of 2GO (2GO GROUP, INC.) as of August 20, 2015.
This completes our THREE for FREE for this week (AGI – Index Stock, POPI – Non-Index Stock and this one 2GO Non-Index Stock).
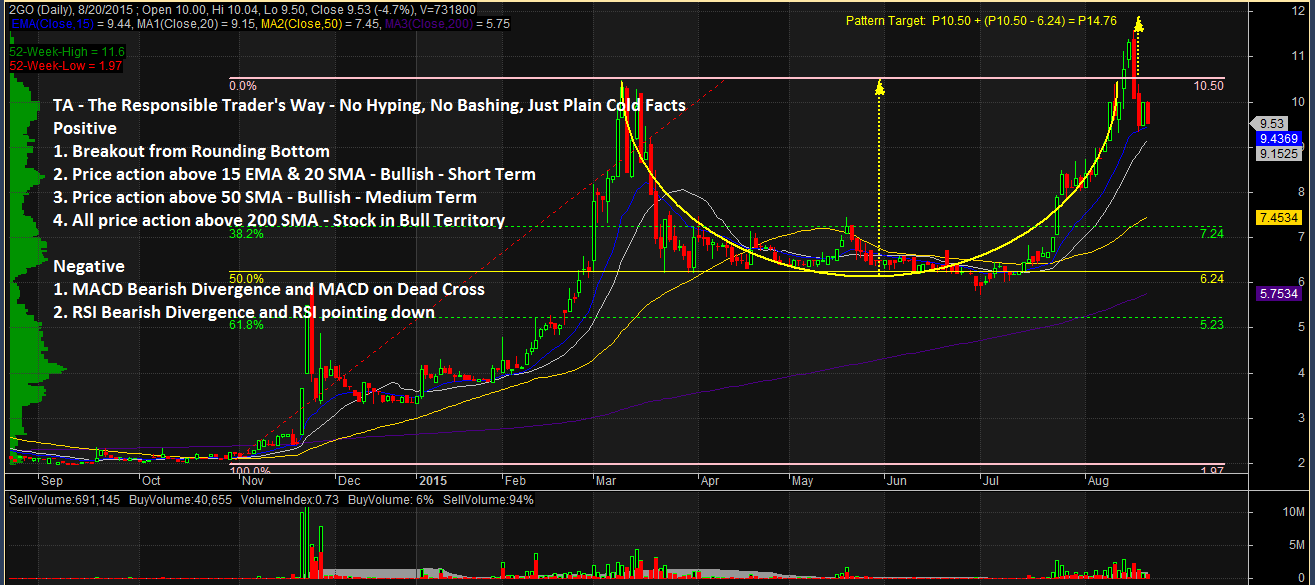
TA – The Responsible Trader’s Way – No Hyping, No Bashing, Just Plain Cold Facts
Positive
1, Breakout from Rounding Bottom. The stock has recently broken out from a Rounded Bottom Chart Pattern giving a Pattern Target of P14.76.
2. Price action above 15 EMA and 20 SMA – Bullish – Short Term. Price action above 15 EMA and 20 SMA shows that the stock in Bullish on the Short Term.
3. Price action above 50 SMA – Bullish – Medium Term. Price action above 50 SMA shows that the stock is Bullish on the Medium Term.
4. All price action above 200 SMA – Since last November 2014 even up the the time of consolidation, the stock’s price action has been above the 200 SMA showing that the stock has never left the Bull Territory.
Negative

1 MACD Bearish Divergence. Although the stock has made a new Higher High, MACD did not follow suit. Moreover, the MACD has just made a Dead Cross and the histogram is decreasing showing a weakening of the stock’s momentum.
2. RSI Bearish Divergence. Although the stock has made a new Higher High, RSI did not behave the same way. Furthermore, the RSI is now pointing down confirming a weakening of trend strength.
In Responsible Trading, Divergences are considered as probable turning points but never as Buy or Sell signals. Therefore we always wait for price confirmation before we take a position.
NOTES:
1. Positive points are things that could work in your favor. Negative points are things that you have to watch out for.
2. On the opposite side of Pattern Targets are Pattern Failures. In case you decide to take this trade, always remember to set a stop loss based on your established risk tolerance level.
The Chart and Analysis is presented for educational purposes only and should NEVER BE TAKEN as a RECOMMENDATION to BUY, HOLD, or SELL.
Please trade with CAUTION, please trade with CARE. As always, IT’S YOUR TAKE, IT’S YOUR CALL. IT’S YOUR MONEY AFTER ALL.
Good luck on all your trades.