STOCK CHARTS AND ANALYSIS – AGI
STOCK CHARTS AND ANALYSIS – AGI
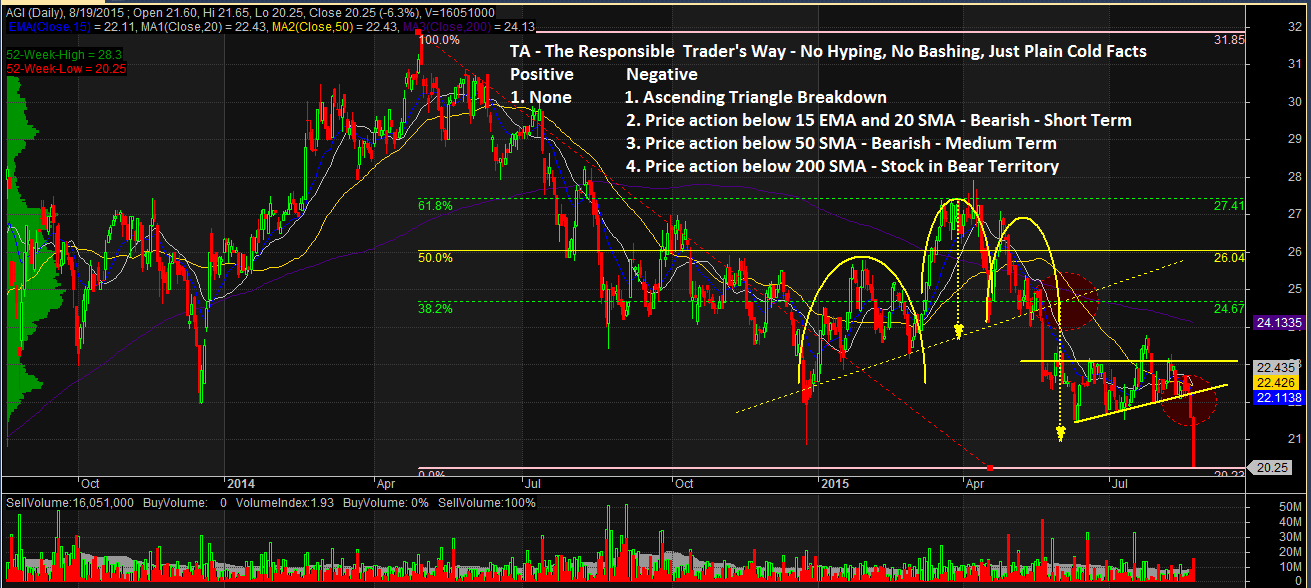
In accordance with our Independence Day commitment, following is our Technical Analysis of AGI (ALLIANCE GLOBAL GROUP, INC.) as of August 19, 2015.
This is the second of our THREE for FREE for this week.
TA – The Responsible Trader’s Way – No Hyping, No Bashing Just Plain Cold Facts
Positive
1. None. Based on Technicals we do not see anything good going for AGI at this time.
Negative
1. Ascending Triangle Breakdown. After completing its Pattern Target from the Head and Shoulders Pattern, the stock tried to rally by consolidating in an Ascending Triangle Pattern. Unfortunately, the Bears stopped the consolidation resulting to another Breakdown.
2. Price action below 15 EMA and 20 SMA – Bearish – Short Term. Price action below 15 EMA and 20 SMA shows that the stock is Bearish in the Short Term.
3. Price action below 50 SMA – Bearish – Medium Term. Price action below 50 SMA also shows that the stock is Bearish on the Medium Term.
4. Price action below 200 SMA – Bearish – Long Term. After the Double Breakdowns, the stock’s price action has been below the 200 SMA confirming that the Stock is now in Bear Territory.
NOTES:
1. Positive points are things that could work in your favor. Negative points are things that you have to watch out for.
2. On the opposite side of Pattern Targets are Pattern Failures. In case you decide to take this trade, always remember to set a stop loss based on your established risk tolerance level.
The Chart and Analysis is presented for educational purposes only and should NEVER BE TAKEN as a RECOMMENDATION to BUY, HOLD, or SELL.
Please trade with CAUTION, please trade with CARE. As always, IT’S YOUR TAKE, IT’S YOUR CALL. IT’S YOUR MONEY AFTER ALL.
Good luck on all your trades.
Nice analysis, buti SL n aq sa 21.90, hehehe… Sir question lng, pano malalaman yung buy at sell volume sa chart nyo?
Hi Aldin,
Thank you for comment. Regarding your question, I have a Custom Indicator in my Charting Sofware, Amibroker, that show the Buy Ups and the Sell Downs and the Volumes are automatically indicated on the Chart as you observed. Are you using Amibroker? Please send me an email at ninjatrader919@gmail.com so I can share the AFL with you.
Yes sir im using Amibroker. Sent you an email sir…
Hi Aldrin,
Please check your email. I have already sent the AFL you requested.