STOCK CHARTS AND ANALYSIS – ALI
STOCK CHARTS AND ANALYSIS – ALI
In accordance with our Independence Day commitment, following is our Technical Analysis of ALI (AYALA LAND, INC) as of June 17, 2015.
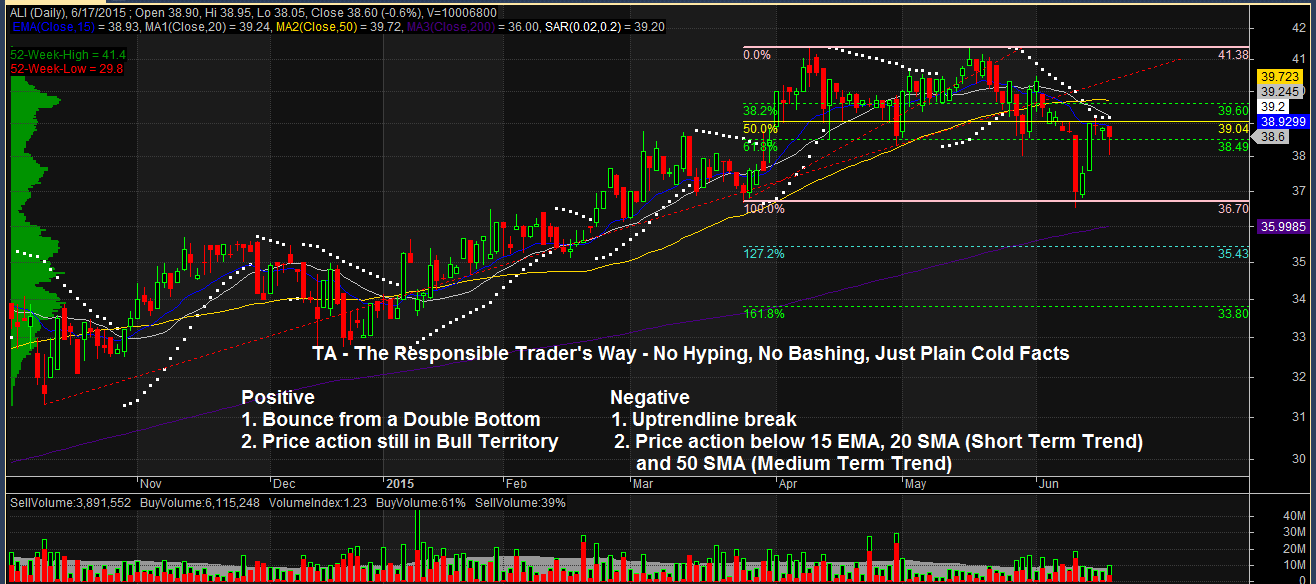
TA – The Responsible Trader’s Way – No Hyping, No Bashing, Just Plain Cold Facts.
Positive
1. Bounce from a Double Bottom. After hitting a 100% Retracement from its previous Swing Low, ALI is now attempting to stage a comeback.
2, Price action is still in Bull territory. Current Price action is still above 200 SMA (Long Term Trend).
Negative
1. Uptrendline break. Stock has broken its uptrendline and retraced 100% from its previous Swing Low.
2. Price action below 15 EMA, 20 SMA (Short Term Trend) and 50 SMA (Medium Term Trend) . ALI needs to stay above these Moving Averages to resume its Uptrendline.
NOTE:
- Positive points are things that could work in your favor. Negative points are things that you have to watch out for.
The Chart and Analysis is presented for educational purposes only and should NEVER BE TAKEN as a RECOMMENDATION to BUY, HOLD, or SELL.
Please trade with CAUTION, please trade with CARE. As always, IT’S YOUR TAKE, IT’S YOUR CALL. IT’S YOUR MONEY AFTER ALL.
Good luck on all your trades