STOCK CHARTS AND ANALYSIS – BLOOM
STOCK CHARTS AND ANALYSIS – BLOOM
In accordance with our Independence Day commitment, following is our Technical Analysis of BLOOM (BLOOMBERRY RESORTS CORPORATION) as of Dec. 11, 2015.
This is the third of our THREE for FREE for this week: DNL – Non-Index Stock, FNI – Non-Index Stock and this one an Index Stock. (This completes our NINE IN THE EYES OF MINE for this week. Six have been posted in my BooKAKA Premium Sentiment: PNX, SPH, DD, DMPL, WEB, JFC).
TA – TRT Way – Straight from the Chart
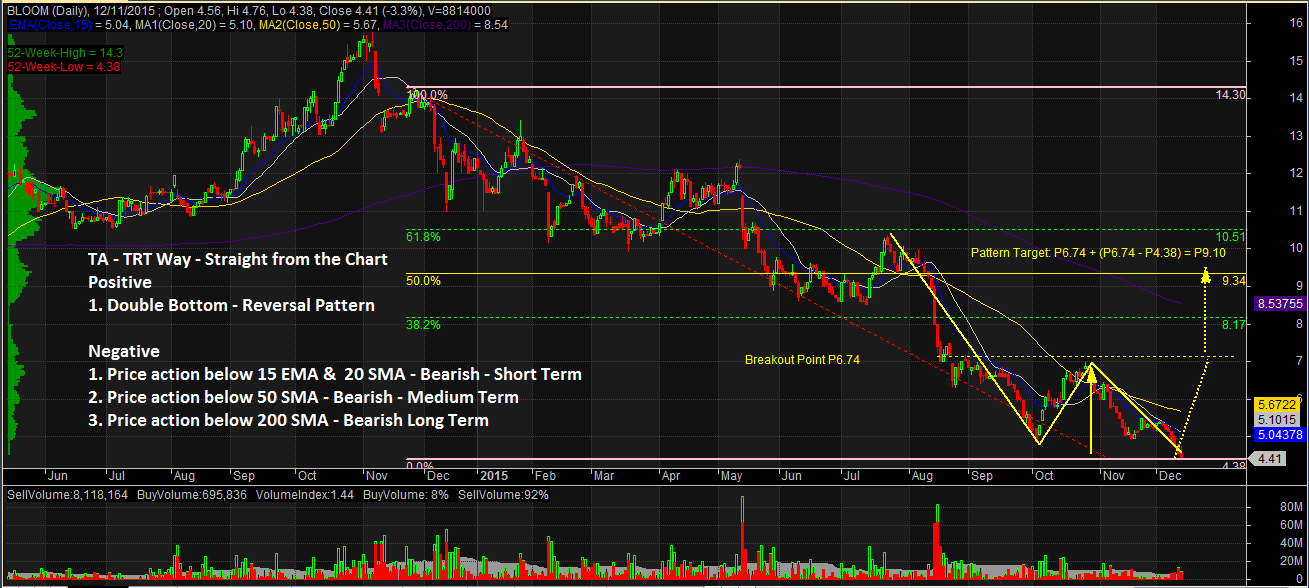
POSITIVE
1. Double Bottom Pattern. BLOOM has continued its downtrend and in the process formed a Double Bottom Pattern. This Pattern is very well known to Technical Analysts as a Reversal Pattern. The only problem is WHEN? It needs breakout from P6.74 to confirm Reversal. Once broken, this could send the stock to its Pattern Target of P9.10.
NEGATIVE
1. Price action below 15 EMA & 20 SMA – Bearish – Short Term. The stock’s price action below 15 EMA & 20 SMA sho1ws that it is Bearish on the Short Term.
2. Price action below 50 SMA – Bearish – Medium Term. The stock’s price action below 50 SMA shows that it is Bearish on the Medium Term.
3. Price action below 200 SMA – Bearish – Long Term. The stock’s price action below 200 SMA shows that it is Bearish on the Long Term. Since early part of January this year, the Stock had been in Bear Territory and remained there up to this time.
NOTES:
1. Positive points are things that could work in your favor. Negative points are things that you have to watch out for.
2. On the opposite side of Pattern Targets are Pattern Failures. In case you decide to take this trade, always remember to set a stop loss based on your established risk tolerance level.
3. September is a very significant month for us. It was at the same time this year that we introduced Responsible Trading to mainstream social media. Starting September 1, 2015, since you are already familiar with our caption “TA – The Responsible Trader’s Way – No Hyping, No Bashing, Just Plain Cold Facts” we are changing this to TA – TRT Way – Straight from the Chart.
The Chart and Analysis is presented for educational purposes only and should NEVER BE TAKEN as a RECOMMENDATION to BUY, HOLD, or SELL.
Please trade with CAUTION, please trade with CARE. As always, IT’S YOUR TAKE, IT’S YOUR CALL. IT’S YOUR MONEY AFTER ALL.
Good luck on all your trades.