STOCK CHARTS AND ANALYSIS – BLOOM
STOCK CHARTS AND ANALYSIS – BLOOM
In accordance with our Independence Day commitment, following is our Technical Analysis of BLOOM (BLOOMBERRY RESORTS CORPORATION) as of July 15, 2015.
This is the second of our THREE for FREE for this week.
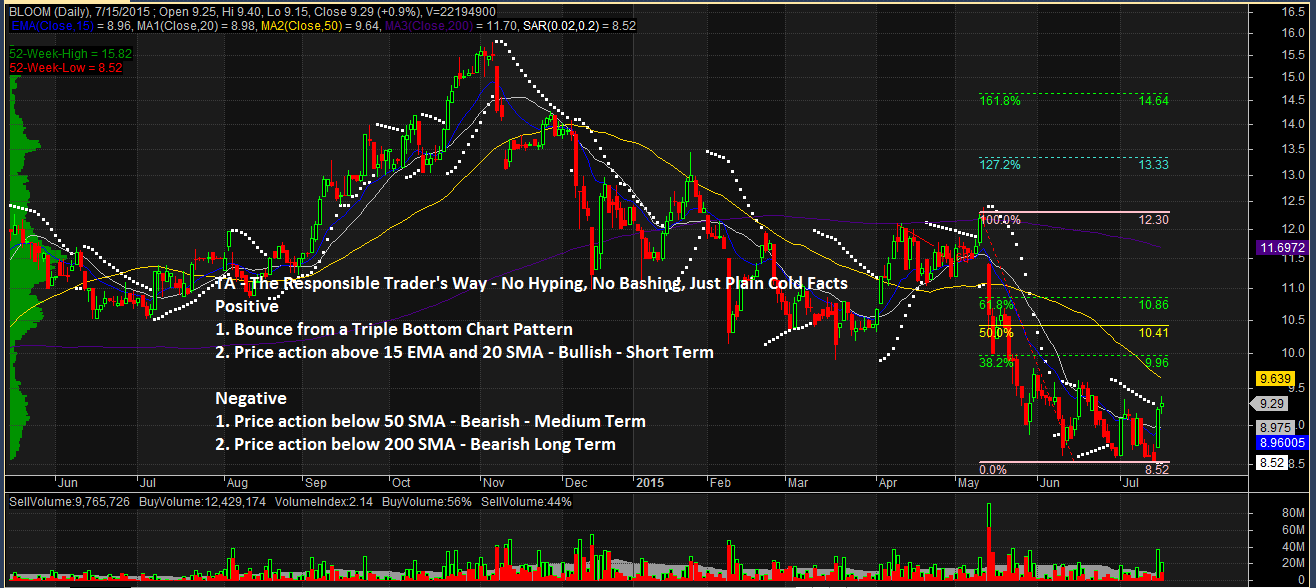
TA – The Responsible Trader’s Way – No Hyping, No Bashing Just Plain Cold Facts.
Positive
1. Bounce from a Triple Bottom Chart Pattern. The stock seems to have hit the end of its downtrend after hitting the P8.50 level three times. However, it needs to break P9.96 (38.2% Fibo Resistance) convincingly with high volume as confirmation.
2. Recent price action above 15 EMA and 20 SMA – Bullish – Short Term. After bouncing from the Triple Bottom Chart Pattern, the stock was able to rise above its Short Term Moving Averages.
Negative
1. Price Action below 50 SMA – Bearish – Medium Term. BLOOM’s price action is still below the 50 SMA indicating that the stock is still Bearish on the Medium Term.
2. Price action also below 200 SMA. This shows that the stock is Bearish in the Long Term and confirms that the stock still remains in Bear territory.
NOTE: Positive points are things that could work in your favor. Negative points are things that you have to watch out for.
The Chart and Analysis is presented for educational purposes only and should NEVER BE TAKEN as a RECOMMENDATION to BUY, HOLD, or SELL.
Please trade with CAUTION, please trade with CARE. As always, IT’S YOUR TAKE, IT’S YOUR CALL. IT’S YOUR MONEY AFTER ALL.
Good luck on all your trades.