STOCK CHARTS AND ANALYSIS – BPI
We are feeling extra generous today. Instead of our schedule to share our Stock Charts and Analysis of one Index Stock every week, due to popular request, we are sharing two Index Stocks today: AC (AYALA CORPORATION) and BPI (BANK OF THE PHILIPPINE ISLANDS).
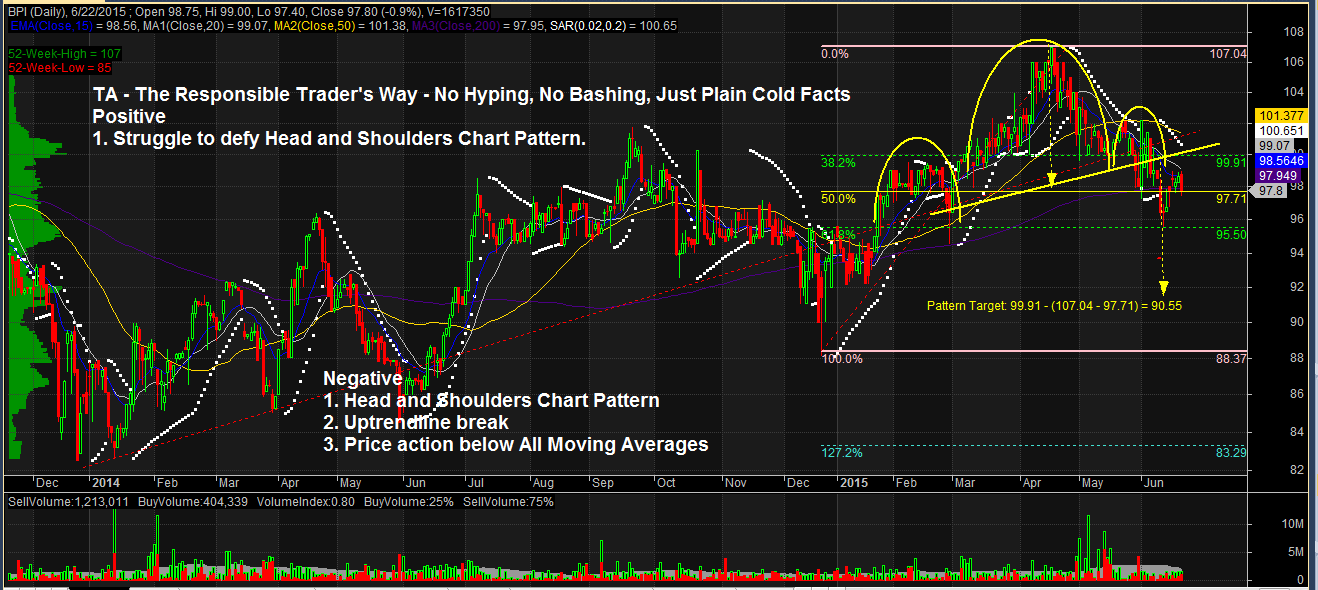
In accordance with our Independence Day commitment, following is our Technical Analysis of BPI (BANK OF THE PHILIPPINE ISLANDS) as of June 22, 2015.
TA – The Responsible Trader’s Way – No Hyping, No Bashing, Just Plain Cold Facts.
Positive
1. Strugggle to defy Head and Shoulders. Latest price action shows that BPI is attempting to defy a recently formed Head and Shoulders Chart Pattern.
Negative.
1, Head and Shoulders Chart Pattern. BPI has recently formed a Head and Shoulders Chart Pattern. Failure to break P99.92 (38.2% Fibo) could send the stock down to its Pattern Target of 90.55.
2, Uptrendline break. BPI has broken its uptrendline and completed the Neckline of the Head and Shoulders Pattern.
3. Recent price action are below all Moving Averages. Price action below 200 SMA (A generally accepted trading standard) confirms that stock is now in bear territory.
NOTES:
- Positive points are things that could work in your favor. Negative points are things that you have to watch out for.
- On the opposite side of Pattern Targets are Pattern Failures. In case you decide to take this trade, always remember to set a stop loss based on your established risk tolerance level.
The Chart and Analysis is presented for educational purposes only and should NEVER BE TAKEN as a RECOMMENDATION to BUY, HOLD, or SELL.
Please trade with CAUTION, please trade with CARE. As always, IT’S YOUR TAKE, IT’S YOUR CALL. IT’S YOUR MONEY AFTER ALL.
Good luck on all your trades