STOCK CHARTS AND ANALYSIS – DMC
STOCK CHARTS AND ANALYSIS – DMC
In accordance with our Independence Day commitment, following is our Technical Analysis of DMC (DMCI HOLDINGS, INC .) as of August 26, 2015.
This is the last of our THREE for FREE for this week, PX and LPZ – Non Index Stocks and this one DMC Index Stock.
TA – The Responsible Trader’s Way – No Hyping, No Bashing Just Plain Cold Facts
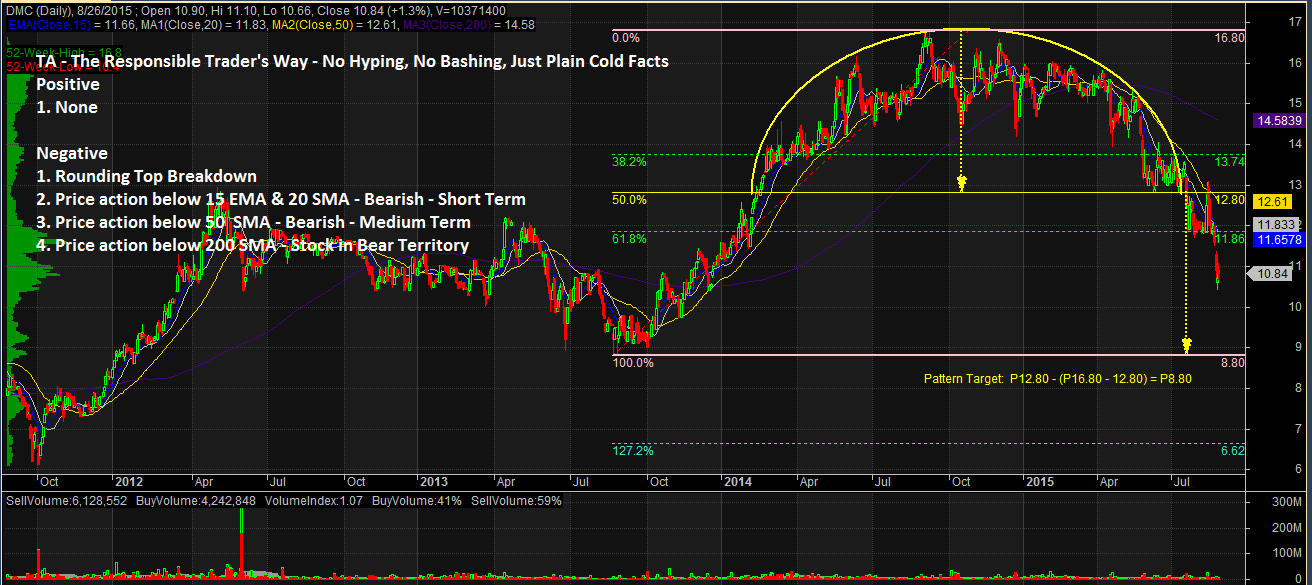
Positive
1. None. Based on technicals, we do not see anything positive about the stock right now.
Negative
1. Rounding Top Breakdown. DMC broke down from a Rounding Top Pattern with a Pattern Target of P8.00. To defy this Target it needs to regain P11.86 (61.8% Fibo).
2. Price action below 15 EMA and 20 SMA – Bearish – Short Term. Price action below 15 EMA and 20 SMA shows that the stock is Bearish in the Short Term.
3. Price action below 50 SMA – Bearish – Medium Term. Price action below 50 SMA shows that the stock is Bearish on the Medium Term
4. Price action below 200 SMA – Stock in Bear territory. The stock’s recent price action below 200 SMA shows that the stock is in Deep Bear territory.
NOTES:
1. Positive points are things that could work in your favor. Negative points are things that you have to watch out for.
2. On the opposite side of Pattern Targets are Pattern Failures. In case you decide to take this trade, always remember to set a stop loss based on your established risk tolerance level.
The Chart and Analysis is presented for educational purposes only and should NEVER BE TAKEN as a RECOMMENDATION to BUY, HOLD, or SELL.
Please trade with CAUTION, please trade with CARE. As always, IT’S YOUR TAKE, IT’S YOUR CALL. IT’S YOUR MONEY AFTER ALL.
Good luck on all your trades.