STOCK CHARTS AND ANALYSIS – DNL
STOCK CHARTS AND ANALYSIS – DNL
In accordance with our Independence Day commitment, following is our Technical Analysis of DNL (D & L INDUSTRIES, INC.) as of September 30, 2015.
This is the first of our THREE for FREE for this week.
TA – The Responsible Trader’s Way – Straight from the Chart
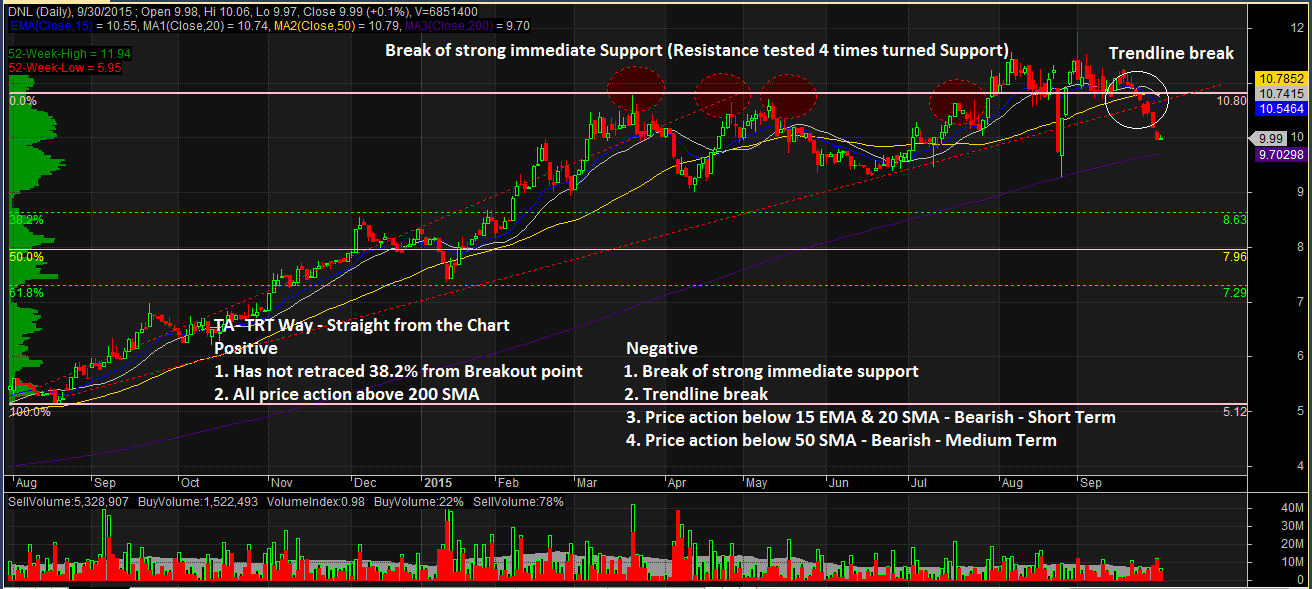
Positive
1. Has not retraced 38.2% from Breakout Point. After breaking out at P10.80, DNL has started to pullback but has not retraced 38.2% from breakout point. A break of P8.63 (38.2%) Fibo could signal a change in trend direction.
2. Price action above 200 SMA. All of DNL’s price action have been above 200 SMA showing that the stock has never entered the Bear Territory.
Negative
1. Break of strong immediate Support. DNL has broken a very strong immediate support (Resistance tested four times turned to Support) indicating a weakness in its Uptrend.
2. Trendline break. DNL has recently had a trendline break and this could further confirm weakness in its Uptrend.
3. Price action below 15 EMA and 20 SMA – Bearish – Short Term. DNL’s current price action below 15 EMA and 20 SMA show that the stock is Bearish on the Short Term.
4. Price action below 50 SMA – Bearish – Medium Term. DNL’s recent price action below 50 SMA shows that the stock is Bearish on the Medium Term.
NOTES:
1. Positive points are things that could work in your favor. Negative points are things that you have to watch out for
2. On the opposite side of Pattern Targets are Pattern Failures. In case you decide to take this trade, always remember to set a stop loss based on your established risk tolerance level.
3. September is a very significant month for us. It was at the same time this year that we introduced Responsible Trading to mainstream social media. Starting September 1, 2015, since you are already familiar with our caption “TA – The Responsible Trader’s Way – No Hyping, No Bashing, Just Plain Cold Facts” we are changing this to TA – TRT Way – Straight from the Chart.
The Chart and Analysis is presented for educational purposes only and should NEVER BE TAKEN as a RECOMMENDATION to BUY, HOLD, or SELL.
Please trade with CAUTION, please trade with CARE. As always, IT’S YOUR TAKE, IT’S YOUR CALL. IT’S YOUR MONEY AFTER ALL.
Good luck on all your trades.