Stock Charts and Analysis – DNL
Stock Charts and Analysis – DNL
Posted in Facebook Trading Groups: June 10, 2015
We were asked again by some traders to weigh in for their favorite stock – DNL. Although she is not one of them this time, this is also for the lady who literally decided to get married to this stock (I saw her post with her marriage vows – “to have and to hold, from this day forward ….”)
TA – The Responsible Trader’s Way – No Hyping, No Bashing Just Plain Cold Facts.
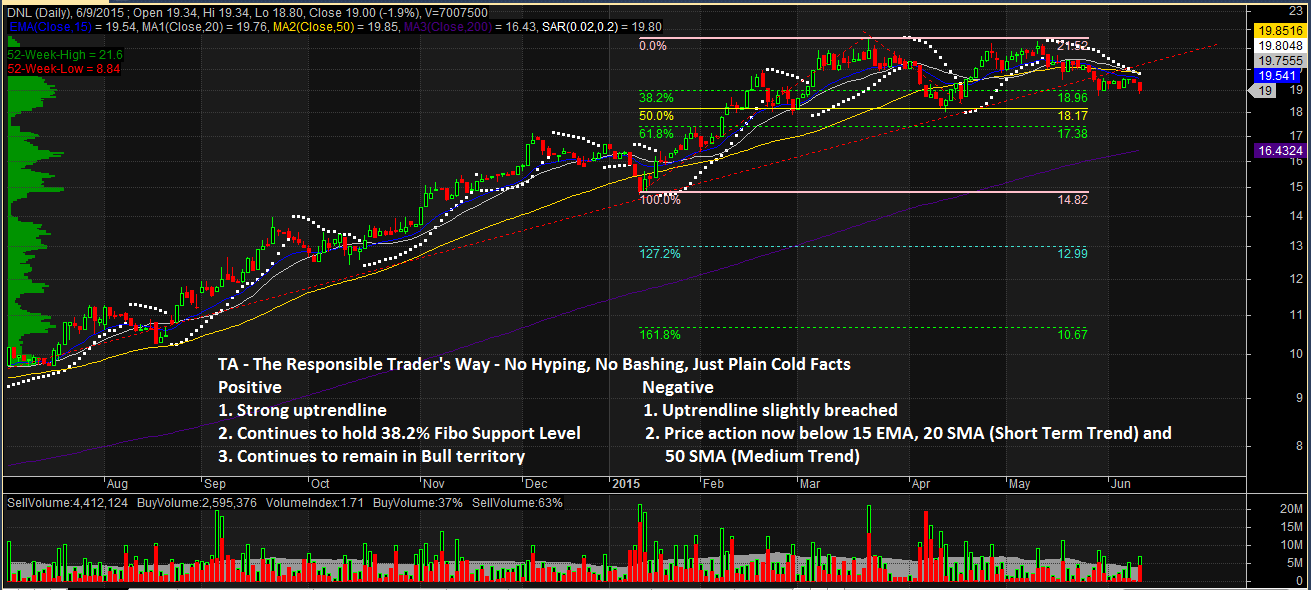
Positive
1. Strong uptrendline – DNL’s trendline is neither steep nor flat and moving at the right angle.
2. Continues to hold P18.96 (38.2% Fibo) Level.
3. Contrinues to remain in Bull Territory (way above 200 SMA)
Negative
1. Price action now below 15 EMA, 20 SMA (Short Term Trend) and 50 SMA (Medium Term Trend.
2. Uptrendline slightly breached.
NOTE: Positive points are things that could work in your favor. Negative points are things that you have to watch out for.
The Chart and Analysis is presented for educational purposes only and should NEVER BE TAKEN as a RECOMMENDATION to BUY, HOLD, or SELL.
Please trade with CAUTION, please trade with CARE. As always, IT’S YOUR TAKE, IT’S YOUR CALL. IT’S YOUR MONEY AFTER ALL.
Good luck on all your trades.