STOCK CHARTS AND ANALYSIS – EDC
STOCK CHARTS AND ANALYSIS – EDC
In accordance with our Independence Day commitment, following is our Technical Analysis of EDC (ENERGY DEVELOPMENT CORP.) as of Sept. 9, 2015.
This is the first of our THREE for FREE for this week.
TA – TRT Way – Straight from the Chart
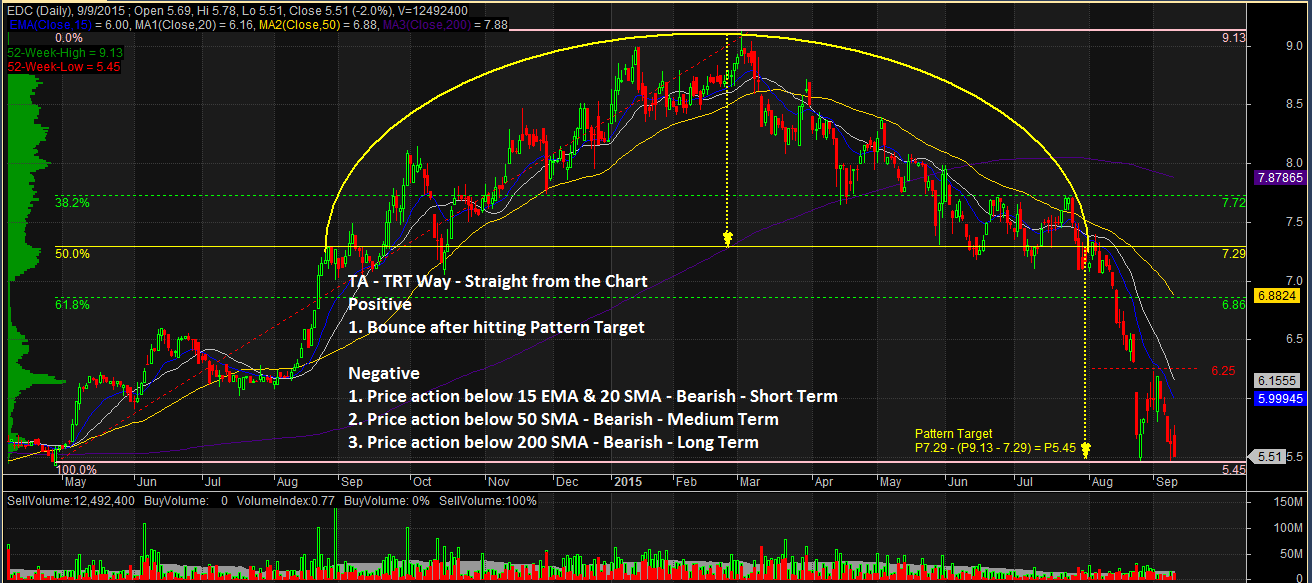
POSITIVE
1. Bounce after hitting Pattern Target. EDC completed a Rounding Top Pattern and hit its Pattern Target of P5.45. The stock is attempting to make a comeback. It needs to breach the gap at P6.25 to confirm the bounce.
NEGATIVE
1. Price action below 15 EMA and 20 SMA – Bearish – Short Term. Price action below 15 EMA and 20 SMA shows that the stock is Bearish on the Short Term.
2. Price action below 50 SMA – Bearish – Medium Term. Price action below 50 SMA shows that the stock is Bearish on the Medium Term.
3. Price action below 200 SMA – Bearish Long Term. The stock’s price action below 200 after its break down from the Rounding Top Pattern also shows that the stock is still in Bear territory.
NOTES:
1. Positive points are things that could work in your favor. Negative points are things that you have to watch out for.
2. On the opposite side of Pattern Targets are Pattern Failures. In case you decide to take this trade, always remember to set a stop loss based on your established risk tolerance level.
3. September is a very significant month for us. It was at the same time this year that we introduced Responsible Trading to mainstream social media. Starting September 1, 2015, since you are already familiar with our caption “TA – The Responsible Trader’s Way – No Hyping, No Bashing, Just Plain Cold Facts” we are changing this to TA – TRT Way – Straight from the Chart.
The Chart and Analysis is presented for educational purposes only and should NEVER BE TAKEN as a RECOMMENDATION to BUY, HOLD, or SELL.
Please trade with CAUTION, please trade with CARE. As always, IT’S YOUR TAKE, IT’S YOUR CALL. IT’S YOUR MONEY AFTER ALL.
Good luck on all your trades.
actually this is just an explanation of the ma, and is clearly shown that they are in the bear category,
what I would like to know is its fate on the succeeding days and or mos? though as of writing I could see a flock of bids from the price point.
Im wondering also the buy back policy of edc? is this still in effect as of now?
Hi ge,
Yes, this the way we share our TA because we do not want to indicate WHAT and WHEN to BUY, HOLD, or SELL. We trust that by learning from what we have shared through our blog and our videos, our readers will already be able to make their decision using our Charts.