STOCK CHARTS AND ANALYSIS – FNI
STOCK CHARTS AND ANALYSIS – FNI
In accordance with our Independence Day commitment, following is our Technical Analysis of FNI (GLOBAL FERRONICKEL HOLDINGS) as of June 18, 2015.
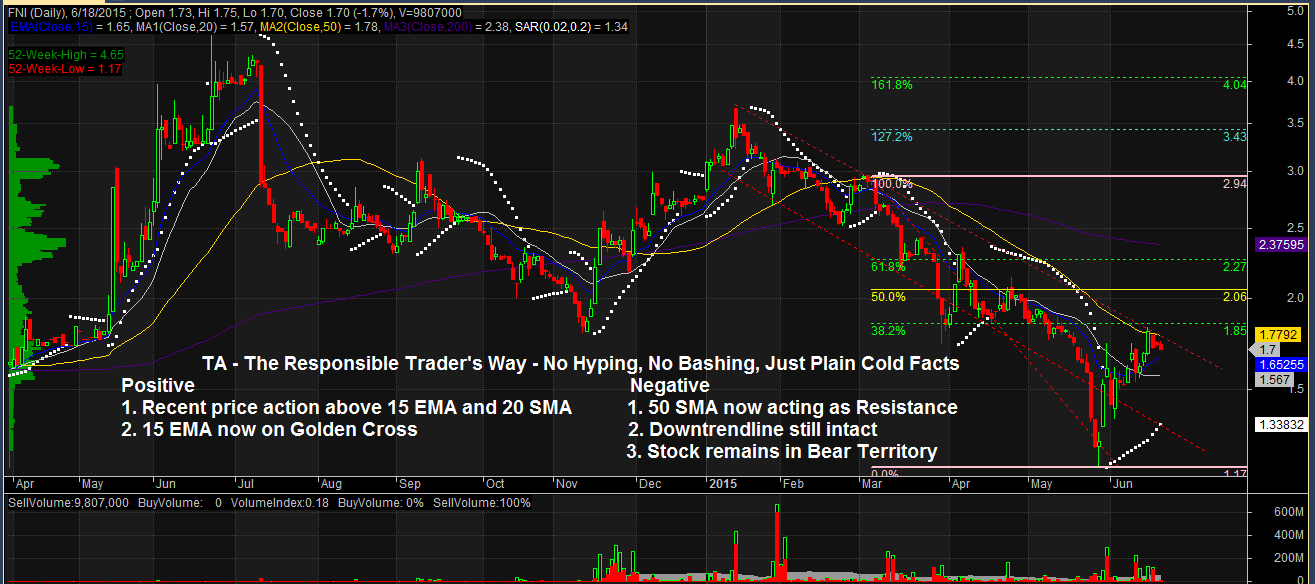
TA – The Responsible Trader’s Way – No Hyping, No Bashing, Just Plain Cold Facts.
Positive
1. Recent price action above Short Term Moving Averages 15 EMA and 20 SMA
2. Short Term Moving Averages now on Golden Cross (15 EMA Crossed over 20 SMA).
Negative.
1. 50 SMA (Medium Term Trend) now acting as Resistance. The 50 SMA together with 38.2% Fibo are acting as Resistance.
2. Downtrendline still intact. All price movements are still within the Downtrend Channel. The stock needs to take out P1.85 with Volume to move out of the Downtrend Channel.
3. Stock still remains in Bear Territory. Price action since March up to present still below 200 SMA (Long Term Trend).
NOTE:
1. Positive points are things that could work in your favor. Negative points are things that you have to watch out for.
The Chart and Analysis is presented for educational purposes only and should NEVER BE TAKEN as a RECOMMENDATION to BUY, HOLD, or SELL.
Please trade with CAUTION, please trade with CARE. As always, IT’S YOUR TAKE, IT’S YOUR CALL. IT’S YOUR MONEY AFTER ALL.
Good luck on all your trades