STOCK CHARTS AND ANALYSIS – GMA7
STOCK CHARTS AND ANALYSIS – GMA7
In accordance with our Independence Day commitment, following is our Technical Analysis of GMA7 (GMA NETWORK, INC. ) as of Sept. 9, 2015.
This is the second of our THREE for FREE for this week.
TA – TRT Way – Straight from the Chart
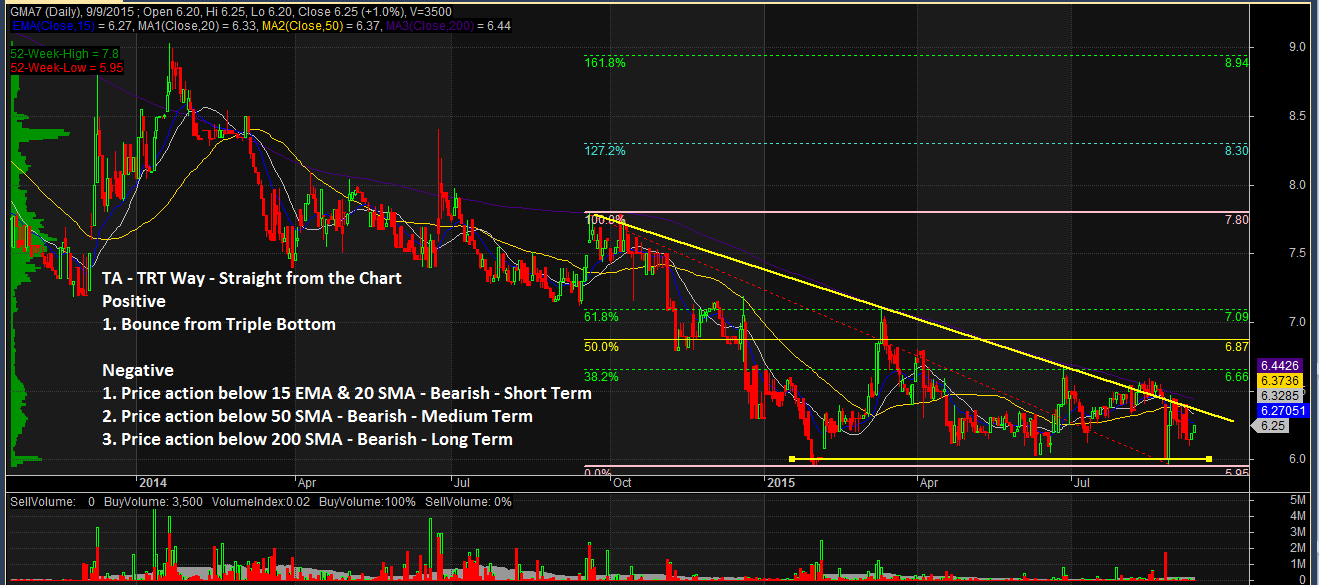
POSITIVE
1. Bounce from Triple Bottom. GMA7 is in the process of completing a Descending Triangle Pattern but bounced after hitting Triple Bottom. It needs to take out P6.66 in order to confirm the bounce.
NOTE: Just some uncanny coincidences. GMA’S radio station DZBB operates on 594 KHZ almost identical to its 52-week low of P5.95 and DZRH its closest rival in the radio broadcast industry operates on 666 KHZ. Call it coincidence but GMA7 has to break P6.66 (Fibo 38.2%) which is exactly identical to DZRH’s frequency on the AM radio band in order to confirm its bounce.
NEGATIVE
1. Price action below 15 EMA and 20 SMA – Bearish – Short Term. Price action below 15 EMA and 20 SMA shows that the stock is Bearish on the Short Term.
2. Price action below 50 SMA – Bearish – Medium Term. Price action below 50 SMA shows that the stock is Bearish on the Medium Term
3. Price action below 200 SMA – Bearish Long Term. The stock’s price action below 200 after its break down from the Rounding Top Pattern also shows that the stock is still in Bear territory.
NOTES:
1. Positive points are things that could work in your favor. Negative points are things that you have to watch out for.
2. On the opposite side of Pattern Targets are Pattern Failures. In case you decide to take this trade, always remember to set a stop loss based on your established risk tolerance level.
3. September is a very significant month for us. It was at the same time this year that we introduced Responsible Trading to mainstream social media. Starting September 1, 2015, since you are already familiar with our caption “TA – The Responsible Trader’s Way – No Hyping, No Bashing, Just Plain Cold Facts” we are changing this to TA – TRT Way – Straight from the Chart.
The Chart and Analysis is presented for educational purposes only and should NEVER BE TAKEN as a RECOMMENDATION to BUY, HOLD, or SELL.
Please trade with CAUTION, please trade with CARE. As always, IT’S YOUR TAKE, IT’S YOUR CALL. IT’S YOUR MONEY AFTER ALL.
Good luck on all your trades.