Stock Charts and Analysis – HOUSE
Stock Charts and Analysis – HOUSE
Posted in Facebook Trading Groups: June 7, 2015
We have been requested again for our Analysis on HOUSE. We are glad that we are now considered the middle ground between the HYPE and the BASH. We are not “ginyuses”, no such pretense, no such claim. We are just trying our best to help in whatever way we can.
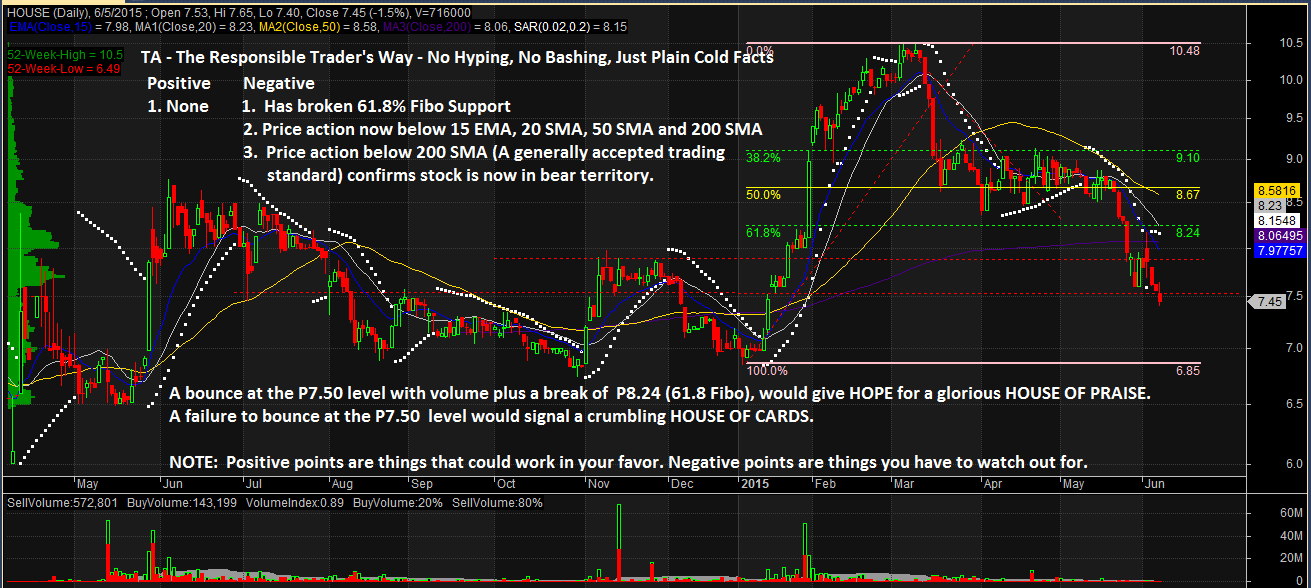
TA – The Responsible Trader’s Way – No Hyping, No Bashing Just Plain Cold Facts.
Positive
1. None – Based on Technicals we do not see anything good going for HOUSE at this time.
Negative
1. The stock has broken P8.24 (61.8% Fibo Support). This is significant because this determines the strength of the downtrend.
2, Price action is now below 15 EMA, 20 SMA (Short Term Trend) 50 SMA (Medium Term Trend) and 200 SMA (Long Term Trend).
3. Price action below 200 SMA (A generally accepted trading standard) confirms that stock is now in bear territory.
NOTE: Positive points are things that could work in your favor. Negative points are things that you have to watch out for.
The Chart and Analysis is presented for educational purposes only and should NEVER BE TAKEN as a RECOMMENDATION to BUY, HOLD, or SELL.
Please trade with CAUTION, please trade with CARE. As always, IT’S YOUR TAKE, IT’S YOUR CALL. IT’S YOUR MONEY AFTER ALL.