STOCK CHARTS AND ANALYSIS – JFC
STOCK CHARTS AND ANALYSIS – JFC
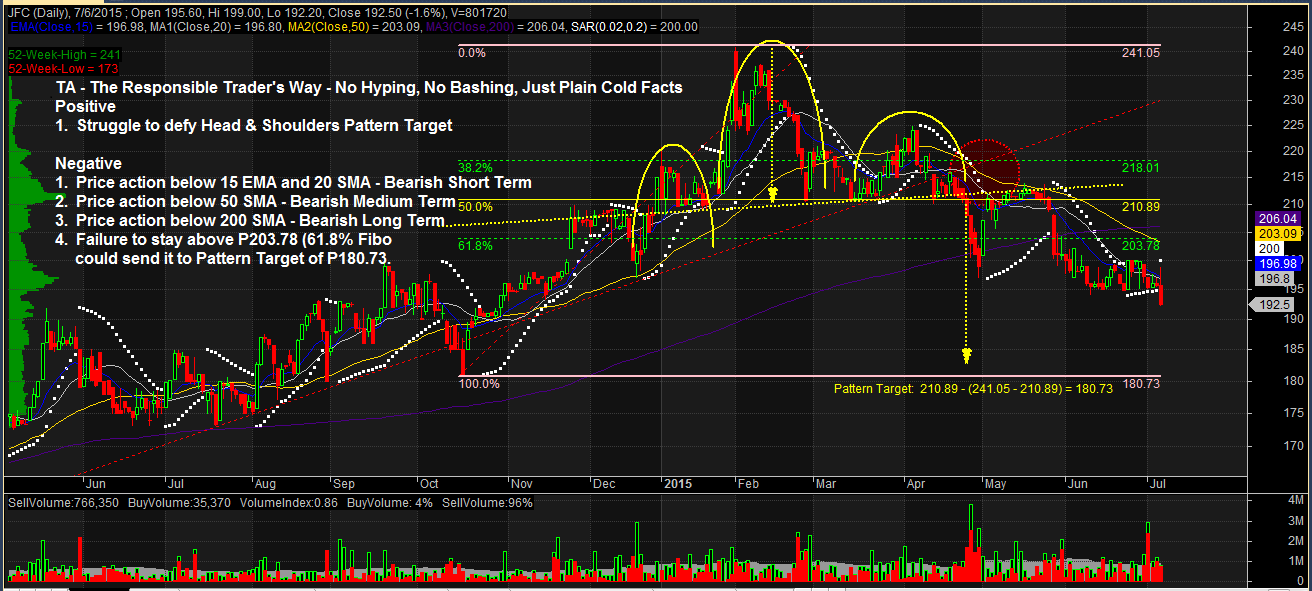
In accordance with our Independence Day commitment, following is our Technical Analysis of JFC (JOLLIBEE FOODS CORPORATION) as of July 6, 2015.
This is the first of our THREE for FREE for this week.
TA – The Responsible Trader’s Way – No Hyping, No Bashing Just Plain Cold Facts.
Positive
1. Struggle to avoid Pattern Target from the Head and Shoulders Pattern.
Negative
1. Recent price action below 15 EMA and 20 SMA. Bearish – Short Term. Recent price action below15 EMA and 20 SMA indicates that the stock is Bearish on the Short Term.
2. Recent price action below 50 SMA. Bearish – Medium Term. Recent price action below 50 SMA indicates that the stock is Bearish on the Medium Term.
3. Recent price action below 200SMA. Bearish – Long Term. Recent price action below 200 SMA confirms that the stock is now in Bear territory.
4. Failure to stay above P203.78 (61.8% Fibo) could send the stock to its Pattern Target of P180.73
NOTE: Positive points are things that could work in your favor. Negative points are things that you have to watch out for.
The Chart and Analysis is presented for educational purposes only and should NEVER BE TAKEN as a RECOMMENDATION to BUY, HOLD, or SELL.
Please trade with CAUTION, please trade with CARE. As always, IT’S YOUR TAKE, IT’S YOUR CALL. IT’S YOUR MONEY AFTER ALL.
Good luck on all your trades