STOCK CHARTS AND ANALYSIS – MER
STOCK CHARTS AND ANALYSIS – MER
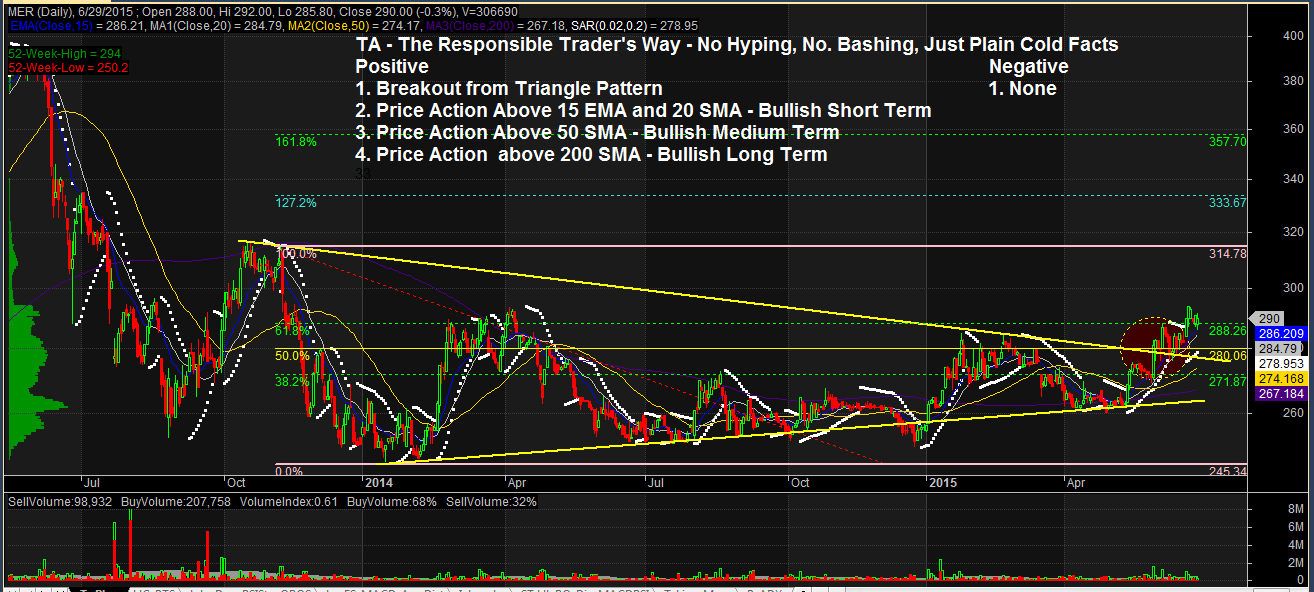
In accordance with our Independence Day commitment, following is our Technical Analysis of MER (MANILA ELECTRIC COMPANY) as of June 29, 2015.
This is the first of our THREE for FREE for this week.
TA – The Responsible Trader’s Way – No Hyping, No Bashing Just Plain Cold Facts.
Positive
1. Breakout from Consolidation. After a long period of Consolidation, MER broke out from a Triangle Pattern.
2. Price Action Above 15 EMA and 20 SMA. Current Price action is above 15 EMA and 20 SMA indicating that the stock is Bullisn on the Short Term.
3. Price Action above 50 SMA. Current Price Action being above 50 SMA indicates that the stock is Bullish on the Medium Term.
4. Price Action above 200 SMA. Current Price Action being above 200 SMA shows that the stock is also Bullish on the Long Term.
Negative
1. None. Based on technicals, we do not see anything negative about MER at this point in time.
.
NOTE: Positive points are things that could work in your favor. Negative points are things that you have to watch out for.
The Chart and Analysis is presented for educational purposes only and should NEVER BE TAKEN as a RECOMMENDATION to BUY, HOLD, or SELL.
Please trade with CAUTION, please trade with CARE. As always, IT’S YOUR TAKE, IT’S YOUR CALL. IT’S YOUR MONEY AFTER ALL.
Good luck on all your trades.