STOCK CHARTS AND ANALYSIS – PCOR
STOCK CHARTS AND ANALYSIS – PCOR
In accordance with our Independence Day commitment, following is our Technical Analysis of PCOR (PETRON CORPORATION) as of July 31, 2015.
This is the first of our THREE for FREE for this week.
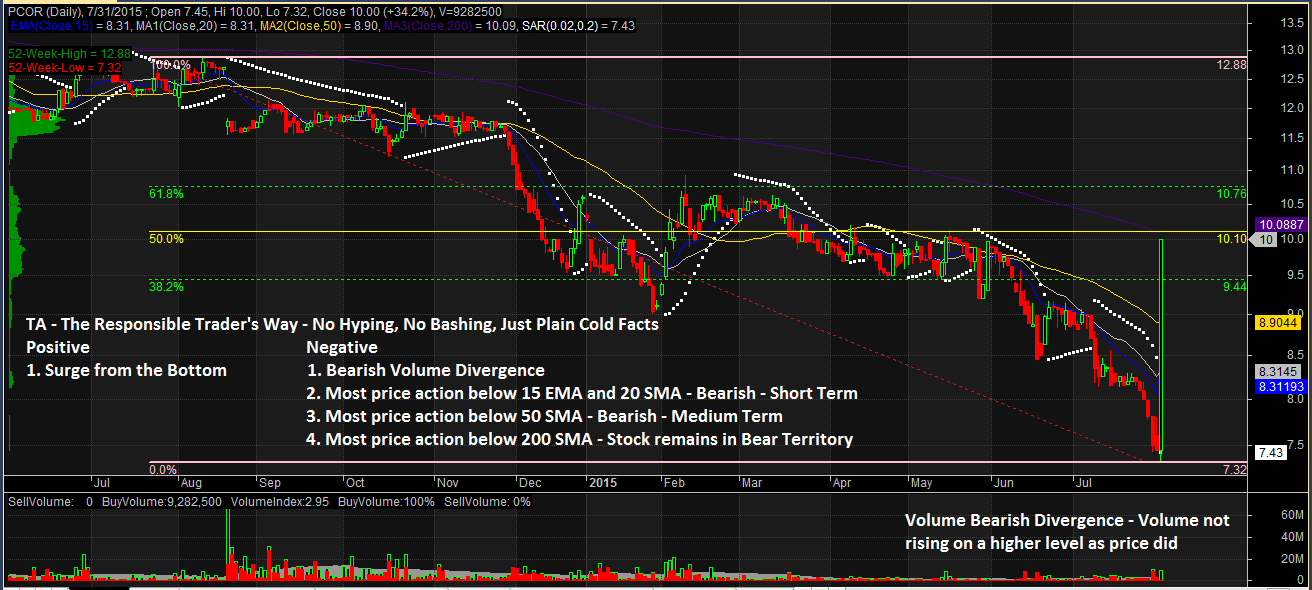
TA – The Responsible Trader’s Way – No Hyping, No Bashing, Just Plain Cold Facts.
Positive
1. Surge from the Bottom. PCOR’s fast and furious move on July 31, 2015 has placed the price above the 15 EMA and 20 SMA and the 50 SMA in just one day.
Negative
1. Volume Bearish Divergence. Although the stock has risen very fast, volume does not seem to support this as indicated by the volume not rising to the same level that price did. This could indicate that the rise in price is not sustainable.
2. Most of price action below below 15 EMA and 20 SMA – Bearish – Short Term. As can be seen in the Chart, except for July 31st, most of PCOR’s price action have been below the 15 EMA and 20 SMA showing that the stock is Bearish in the Short Term.
3. Most of the price action below 50 SMA – Bearish – Medium Term. Again as can be seen in the Chart, except for July 31st, most of PCOR’s price action have been below 50 SMA showing that the stock is Bearish in the Medium Term.
4. Most of the price action below 200 SMA – Stock in Bear territory. Even with the sudden surge in price, all of the stock’s price action are still below the 200 SMA indicating that the stock remains in Bear territory.
NOTES:
1. Positive points are things that could work in your favor. Negative points are things that you have to watch out for.
The Chart and Analysis is presented for educational purposes only and should NEVER BE TAKEN as a RECOMMENDATION to BUY, HOLD, or SELL.
Please trade with CAUTION, please trade with CARE. As always, IT’S YOUR TAKE, IT’S YOUR CALL. IT’S YOUR MONEY AFTER ALL.
Good luck on all your trades.