STOCK CHARTS AND ANALYSIS – PLC
STOCK CHARTS AND ANALYSIS – PLC
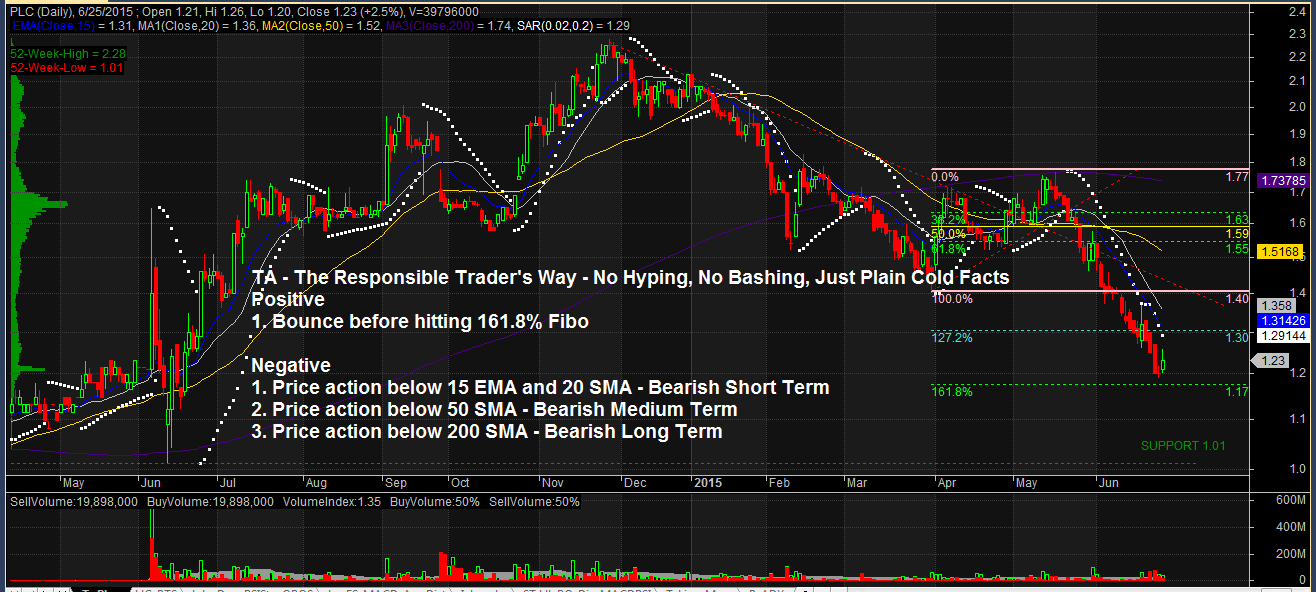
In accordance with our Independence Day commitment, following is our Technical Analysis of PLC (PREMIUM LEISURE CORPORATION) as of June 25, 2015.
TA – The Responsible Trader’s Way – No Hyping, No Bashing Just Plain Cold Facts.
Positive
1. Bounce before hitting 161.8% Fibo could be a signal for trend reversal. However, it needs to break P1.30 convincingly with high volume as confirmation.
Negative
1. Price Action below 15 EMA and 20 SMA. This shows that the stock is Bearish in the Short Term.
2. Price Action below 50 SMA. This shows that the stock is Bearish in the Medium Term.
3, Price action also below 200 SMA. This shows that the stock is Bearish in the Long Term. The stock is definitely in Bear Territory. It needs to hold P1.17 (161.8% Fibo) and break P1.30 convincingly with high volume. Failure to do so might send the stock back to its 52-week low of P1.01
NOTE: Positive points are things that could work in your favor. Negative points are things that you have to watch out for.
The Chart and Analysis is presented for educational purposes only and should NEVER BE TAKEN as a RECOMMENDATION to BUY, HOLD, or SELL.
Please trade with CAUTION, please trade with CARE. As always, IT’S YOUR TAKE, IT’S YOUR CALL. IT’S YOUR MONEY AFTER ALL.
Good luck on all your trades