STOCK CHARTS AND ANALYSIS – PNX
STOCK CHARTS AND ANALYSIS – PNX
In accordance with our Independence Day commitment, following is our Technical Analysis of PNX(PHOENIX PETROLEUM PHILIPPINES) as of Oct. 29, 2015.
This is the third of our THREE for FREE for this week. (SBS – Non Index Stock, SM-Index Stock and this one PNX – Non-Index Stock).
TA-TRT Way – Straight from the Chart
POSITIVE
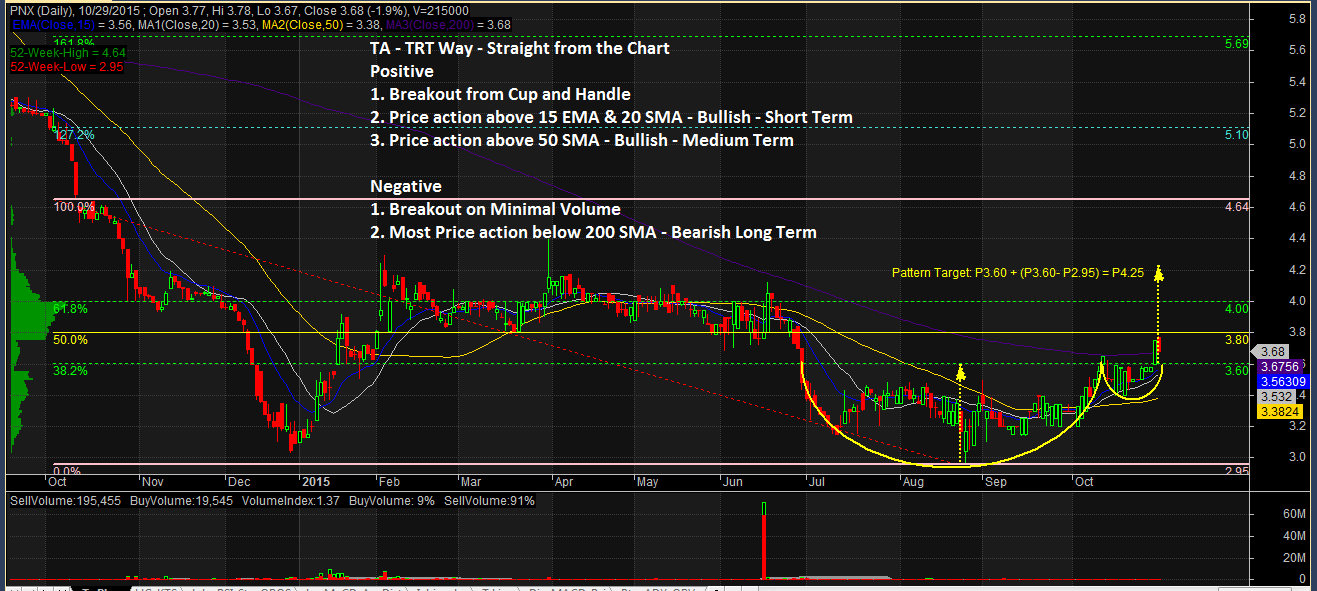
1. Breakout from Cup and Handle. After completing a Cup and Handle Pattern, PNX seems to have broken out and is aiming at a Pattern Target of P4.25.
2. Price action above 15 EMA & 20 SMA – Bullish Short Term. The stock’s price action above 15 EMA & 20 SMA shows that it is Bullish on the Short Term.
3. Price action above 50 SMA – Bullish – Medium Term. The stock’s price action above 50 SMA shows that it is Bullish on the Medium Term.
NEGATIVE
1. Breakout on Minimal Volume. The stock’s breakout does not seem to be supported by a strong volume making it a question whether this is a real breakout or a fakeout. It needs to break P3.80 50% Fibo with strong volume to confirm the breakout. Otherwise it imight prove to be unsustainable.
2. Most Price action below 200 SMA – Almost all of the stock’s price action have been below the 200 SMA indicating that it had been in Bear Territory most of the time. The apparent breakout is also an attempt to get out of the Bear territory. Whether it succeeds in doing so will be seen in a couple of days.
NOTES:
1. Positive points are things that could work in your favor. Negative points are things that you have to watch out for.
2. On the opposite side of Pattern Targets are Pattern Failures. In case you decide to take this trade, always remember to set a stop loss based on your established risk tolerance level.
3. September is a very significant month for us. It was at the same time this year that we introduced Responsible Trading to mainstream social media. Starting September 1, 2015, since you are already familiar with our caption “TA – The Responsible Trader’s Way – No Hyping, No Bashing, Just Plain Cold Facts” we are changing this to TA – TRT Way – Straight from the Chart.
The Chart and Analysis is presented for educational purposes only and should NEVER BE TAKEN as a RECOMMENDATION to BUY, HOLD, or SELL.
Please trade with CAUTION, please trade with CARE. As always, IT’S YOUR TAKE, IT’S YOUR CALL. IT’S YOUR MONEY AFTER ALL.
Good luck on all your trades.