STOCK CHARTS AND ANALYSIS – POPI
STOCK CHARTS AND ANALYSIS – POPI
In accordance with our Independence Day commitment, following is our Technical Analysis of POPI (PRIME ORION PHILIPPINES, INC.) as of August 17, 2015.
This is the first of our THREE for FREE for this week.
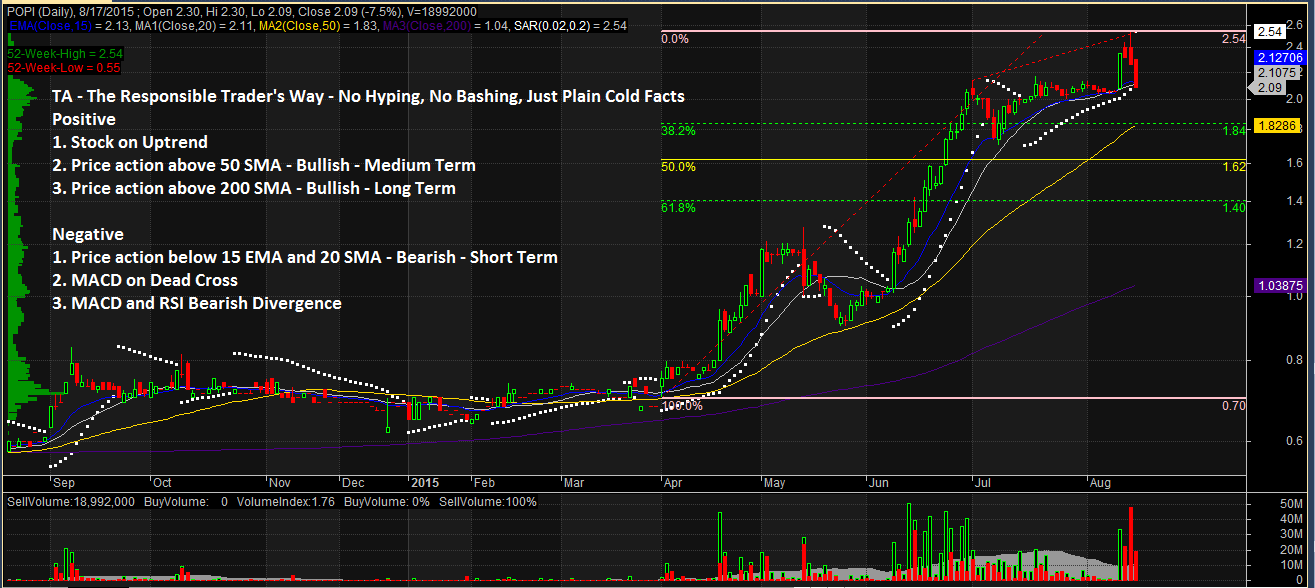
TA – The Responsible Trader’s Way – No Hyping, No Bashing Just Plain Cold Facts
Positive
1. Stock on Uptrend. POPI staged a breakout after a long period of consolidation and continued on an upward course ever since.
2. Price action above 50 SMA. Ever since it made a breakout, the stock’s price action have been above the 50 SMA showing the stock’s Bullishness on the Medium Term.
3. Price action above 200 SMA. As can be seen on the Chart, all of the stock’s price action even during consolidation has been above the 200 SMA indicating the stock’s Bullishness on the Long Term.
Negative
1. Price Action below 15 EMA and 20 SMA. The recent price action below 15 EMA and 20 SMA shows Bearishness in the Short Term.
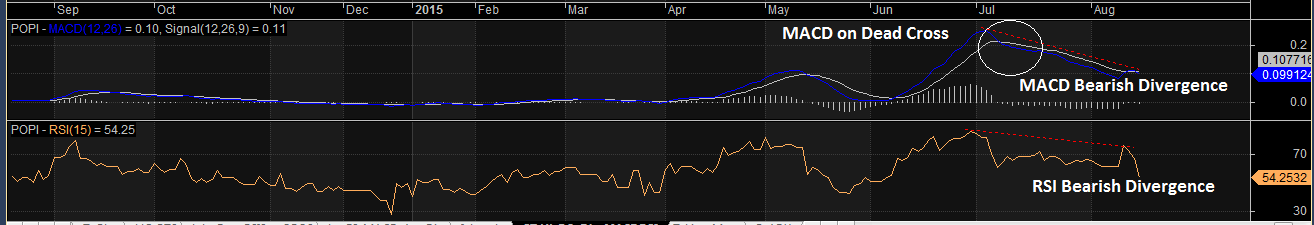
2. MACD on Dead Cross. The MACD has made a Dead Cross indicating a weakening of the stock’s momentum.
3. MACD and RSI Bearish Divergence. As price made a Higher High, MACD and RSI did not follow suit. These divergences confirm a possible retracement from the stock’s upward movement.
NOTE: Positive points are things that could work in your favor. Negative points are things that you have to watch out for.
The Chart and Analysis is presented for educational purposes only and should NEVER BE TAKEN as a RECOMMENDATION to BUY, HOLD, or SELL.
Please trade with CAUTION, please trade with CARE. As always, IT’S YOUR TAKE, IT’S YOUR CALL. IT’S YOUR MONEY AFTER ALL.