STOCK CHARTS AND ANALYSIS – PSEi
STOCK CHARTS AND ANALYSIS – PSEi
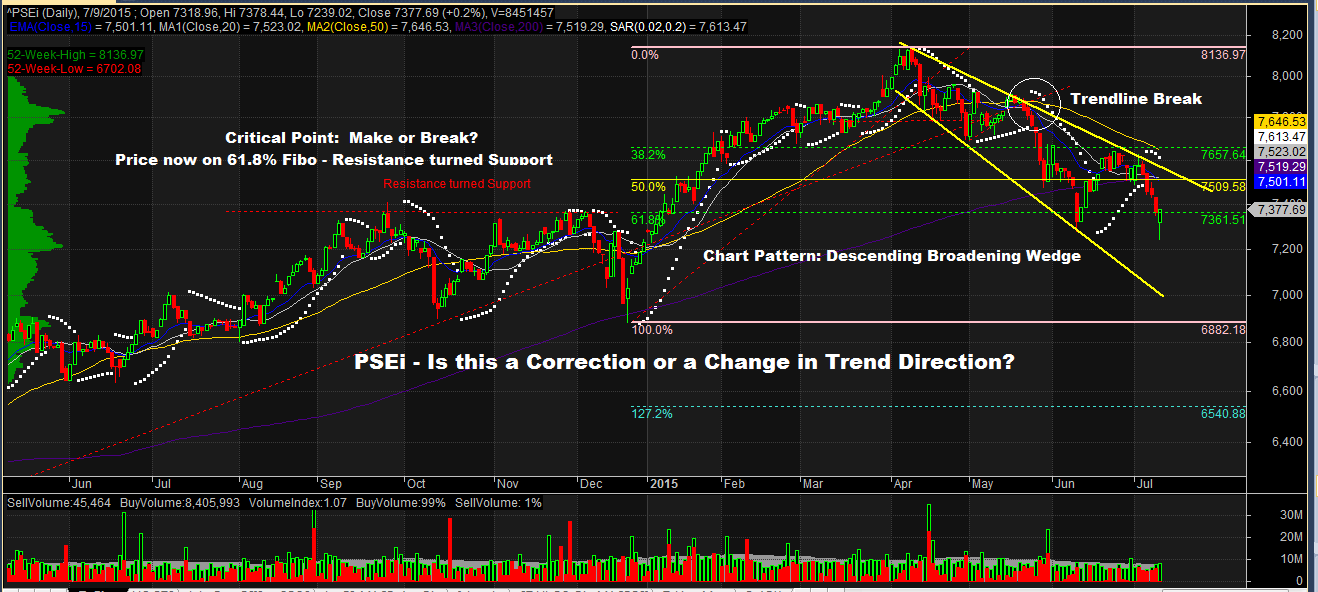
In accordance with our Independence Day commitment, following is our Technical Analysis of PSEi (PSE Index) as of July 9, 2015.
This is in addition to our THREE for FREE for this week. We would like to thank our readers for expressing their trust and confidence in the way we present our Technical Analysis. This really proves that they now want facts, whether positive or negative, so they could be properly guided in making their trading decisions.
One question we have often been asked is: Is this a Correction or a Change in Trend Direction? We will present all of our observations and we will leave it to our readers to answer the question themselves.
TA – The Responsible Trader’s Way – No Hyping, No Bashing Just Plain Cold Facts.
Based on our observation, the Index is showing mixed signals:
Positive
1. The Index appears to be forming a Descending Broadening Wedge. This Chart Pattern is Bullish.
Negative
1. Recent price action below 15 EMA and 20 SMA. Recent price action below 15 EMA and 20 SMA indicates that the Index is Bearish on the Short Term.
2. Recent price action below 50 SMA. Recent price action below 50 SMA indicates that the Index is Bearish on the Medium Term.
3. Recent price action below 200SMA. Recent price action below 200 SMA confirms that the Index is now in Bear territory.
4. Uptrendline Break. The Index’s uptrendline has been broken and has resulted in failure swings with lower peaks and troughs.
Neutral
1. The Index is now on a Critical Point – a Make or Break. The Index is now at 61.8% Fibo – a previous Resistance that has now turned Support. In our opinion, If it stays within this level, we can consider this as still part of the correction. A break of this level with volume will be considered a change in trend direction.
NOTE: Positive points are things that could work in your favor. Negative points are things that you have to watch out for.
The Chart and Analysis is presented for educational purposes only and should NEVER BE TAKEN as a RECOMMENDATION to BUY, HOLD, or SELL.
Please trade with CAUTION, please trade with CARE. As always, IT’S YOUR TAKE, IT’S YOUR CALL. IT’S YOUR MONEY AFTER ALL.
Good luck on all your trades.
Your TAs have been very helpful in my trades as a newbie (I consider myself a newbie) because I know I have a lot to learn in this trade. I consider myself a newbie as I have still to control my emotions which has always been a negative in executing my analysis. The info I get from your articles in THe Responsible Trader re-enforces my decision and execution. Thank you very much for the support you have given to us newbies.
God bless and more power.
Hi SpektrumDSMX,
Thank you for your positive feedback. We are glad that we are able to help you in making your trading decisions. Good luck on all your trades.