STOCK CHARTS AND ANALYSIS – PX
STOCK CHARTS AND ANALYSIS – PX
In accordance with our Independence Day commitment, following is our Technical Analysis of PX (PHILEX MINING CORPORATION) as of August 20, 2015.
This is the first of our THREE for FREE for this week.
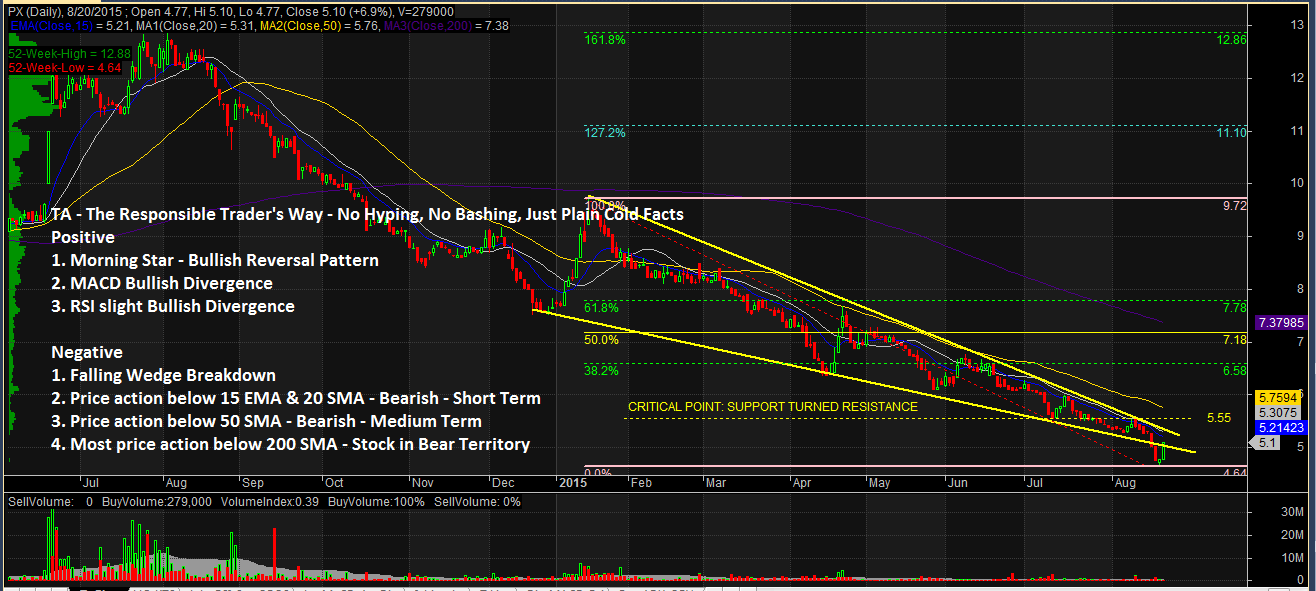
TA – The Responsible Trader’s Way – No Hyping, No Bashing Just Plain Cold Facts
Positive
1. Morning Star – Bullish Reversal Pattern . The last three candlesticks on PX’s Chart is a Morning Star – a Bullish Reversal Pattern. (If the second candlestick was a Doji, it would be called a Morning Doji Star a stronger Bullish Reversal Pattern which increases the chances of a trend reversal).
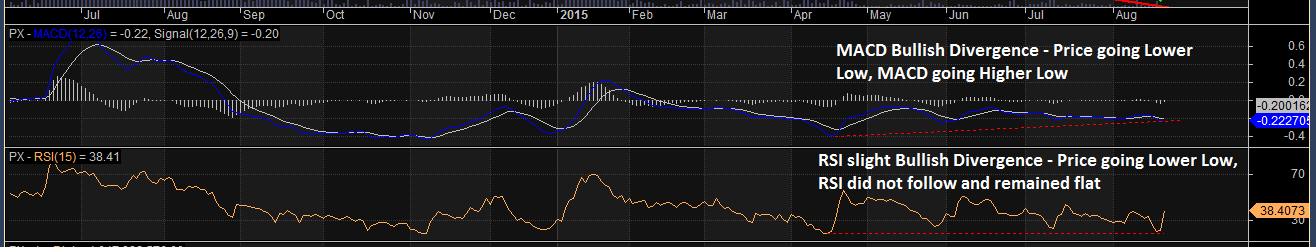
2. MACD Bullish Divergence. While price continued to make a Lower Low, MACD made a Higher Low diverging from price behavior.
3. RSI Slight Bullish Divergence. Unlike price which made a Lower Low, RSI did not follow and remained flat.
We would like to reiterate that in Responsible Trading, Divergences are considered as turning points, never as Buy or Sell signals, therefore, we always wait for confirmation before taking a position.
Negative
1. Falling Wedge Breakdown. After completing a Falling Wedge Pattern, price even fell further. The stock needs to break P5.55, a previous Support now turned Resistance to confirm Trend Reversal.
2. Price action below 15 EMA and 20 SMA – Bearish – Short Term. Price action below 15 EMA and 20 SMA shows that the stock is Bearish in the Short Term.
3. Price action below 50 SMA – Bearish – Medium Term. Price action below 50 SMA shows that the stock is Bearish on the Medium Term.
4. Most price action below 200 SMA – Stock in Bear territory. Since October last year, all of the Stock’s price action has been below the 200 SMA showing that the stock remains in Bear territory.
NOTES:
1. Positive points are things that could work in your favor. Negative points are things that you have to watch out for.
2. On the opposite side of Pattern Targets are Pattern Failures. In case you decide to take this trade, always remember to set a stop loss based on your established risk tolerance level.
The Chart and Analysis is presented for educational purposes only and should NEVER BE TAKEN as a RECOMMENDATION to BUY, HOLD, or SELL.
Please trade with CAUTION, please trade with CARE. As always, IT’S YOUR TAKE, IT’S YOUR CALL. IT’S YOUR MONEY AFTER ALL.
Good luck on all your trades.