STOCK CHARTS AND ANALYSIS – PXP
STOCK CHARTS AND ANALYSIS – PXP
In accordance with our Independence Day commitment, following is our Technical Analysis of PXP (PHILEX PETROLEUM CORPORATION) as of July 9, 2015.
This is the third and completes our THREE for FREE for this week (JFC – Index stock, NIKL – 2nd Liner) and this one PXP – 3rd Liner.
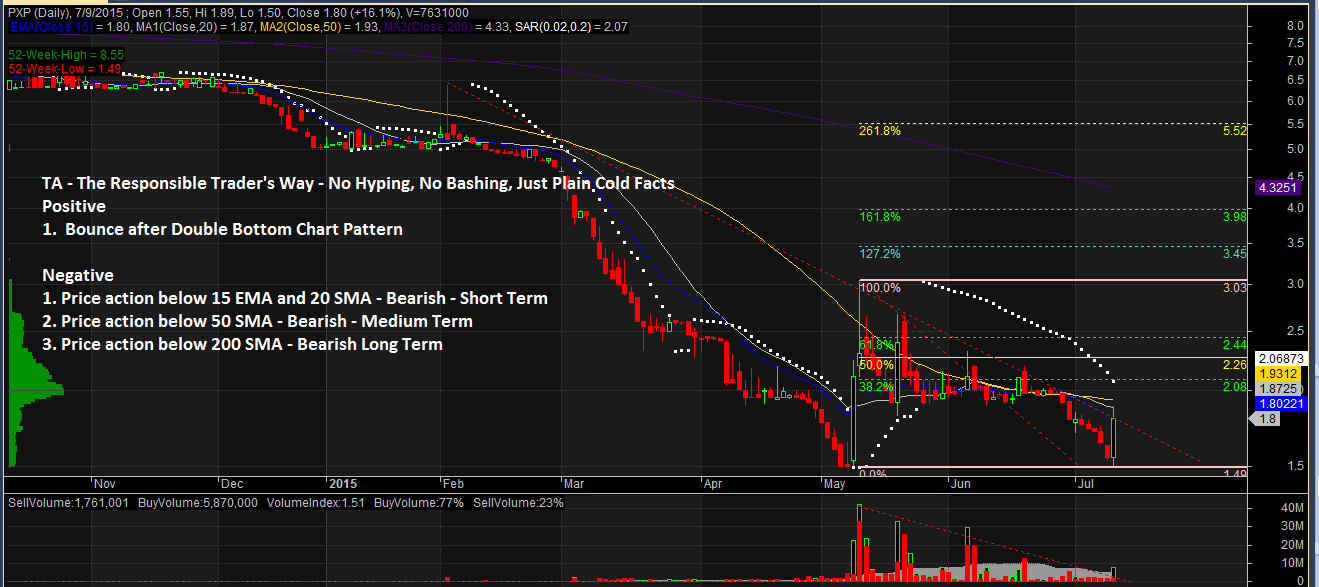
TA – The Responsible Trader’s Way – No Hyping, No Bashing Just Plain Cold Facts.
Positive
1. Bounce after completing a Double Bottom Pattern. PXP appears to have bounced after completing a Double Bottom Chart Pattern. The last two candlestick Pattern, Bullish Engulfing, seems to support this as evidence.
Negative
1. Recent price action below 15 EMA and 20 SMA. Recent price action below 15 EMA and 20 SMA indicates that the stock is Bearish on the Short Term.
2. Recent price action below 50 SMA. Recent price action below 50 SMA indicates that the stock is Bearish on the Medium Term.
3. Recent price action below 200 SMA. Recent price action below 200 SMA confirms that the stock is in Bear territory.
NOTE: Positive points are things that could work in your favor. Negative points are things that you have to watch out for.
The Chart and Analysis is presented for educational purposes only and should NEVER BE TAKEN as a RECOMMENDATION to BUY, HOLD, or SELL.
Please trade with CAUTION, please trade with CARE. As always, IT’S YOUR TAKE, IT’S YOUR CALL. IT’S YOUR MONEY AFTER ALL.
Good luck on all your trades