STOCK CHARTS AND ANALYSIS – RLC
STOCK CHARTS AND ANALYSIS – RLC
In accordance with our Independence Day commitment, following is our Technical Analysis of RLC (ROBINSONS LAND CORPORATION ) as of Oct. 2, 2015.
This is the last of our THREE for FREE for this week. (DNL – Non-Index Stock, LIB – Non-Index Stock and this one RLC – Index Stock).
TA – TRT Way – Straight from the Chart
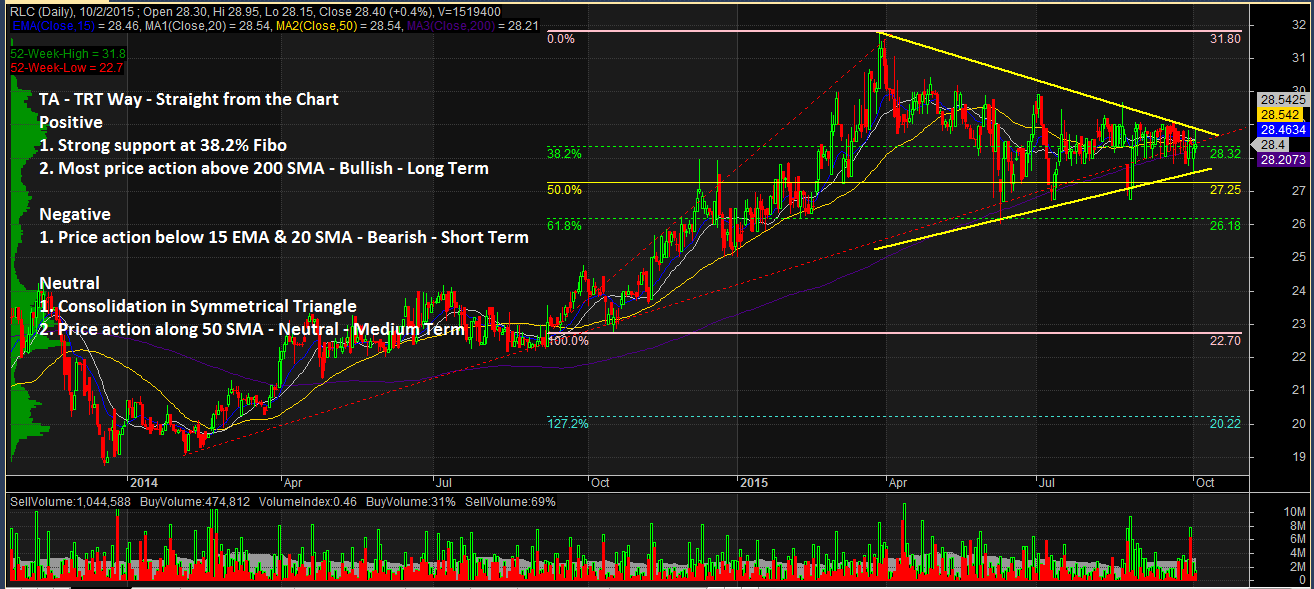
POSITIVE
1. Strong Support at 38.2% Fibo. Based on the cluster of the recent price action the stock seems to have found a strong support at 38.2% Fibo.
2. Most price action above 200 SMA – Bullish – Long Term. Almost all of the stock’s price action even when it hit its 52-week low have been above the 200 SMA indicating that the stock never entered the Bear territory.
NEGATIVE
1. Price action below 15 EMA and 20 SMA – Bearish – Short Term. Recent price action below 15 EMA and 20 SMA shows that the stock is Bearish on the Short Term.
NEUTRAL
1. Consolidation in Symmetrical Triangle. The stock is presently consolidating in a Symmetrical Triangle Pattern. This Pattern is Neutral and could result in either a Breakout or a Breakdown.
2. Price action along 50 SMA – Neutral – Medium Term. The cluster of price action on the 50 SMA shows that the stock is Neutral on the Medium Term.
NOTES:
1. Positive points are things that could work in your favor. Negative points are things that you have to watch out for.
2. On the opposite side of Pattern Targets are Pattern Failures. In case you decide to take this trade, always remember to set a stop loss based on your established risk tolerance level.
3. September is a very significant month for us. It was at the same time this year that we introduced Responsible Trading to mainstream social media. Starting September 1, 2015, since you are already familiar with our caption “TA – The Responsible Trader’s Way – No Hyping, No Bashing, Just Plain Cold Facts” we are changing this to TA – TRT Way – Straight from the Chart.
The Chart and Analysis is presented for educational purposes only and should NEVER BE TAKEN as a RECOMMENDATION to BUY, HOLD, or SELL.
Please trade with CAUTION, please trade with CARE. As always, IT’S YOUR TAKE, IT’S YOUR CALL. IT’S YOUR MONEY AFTER ALL.
Good luck on all your trades.