STOCK CHARTS AND ANALYSIS – SPH
STOCK CHARTS AND ANALYSIS – SPH
In accordance with our Independence Day commitment, following is our Technical Analysis of SPH (SPLASH CORPORATION ) as of Sept. 23, 2015.
This is the second of our THREE for FREE for this week. (GTCAP – Index Stock, and this one SPH – Non-Index Stock).
TA – TRT Way – Straight from the Chart
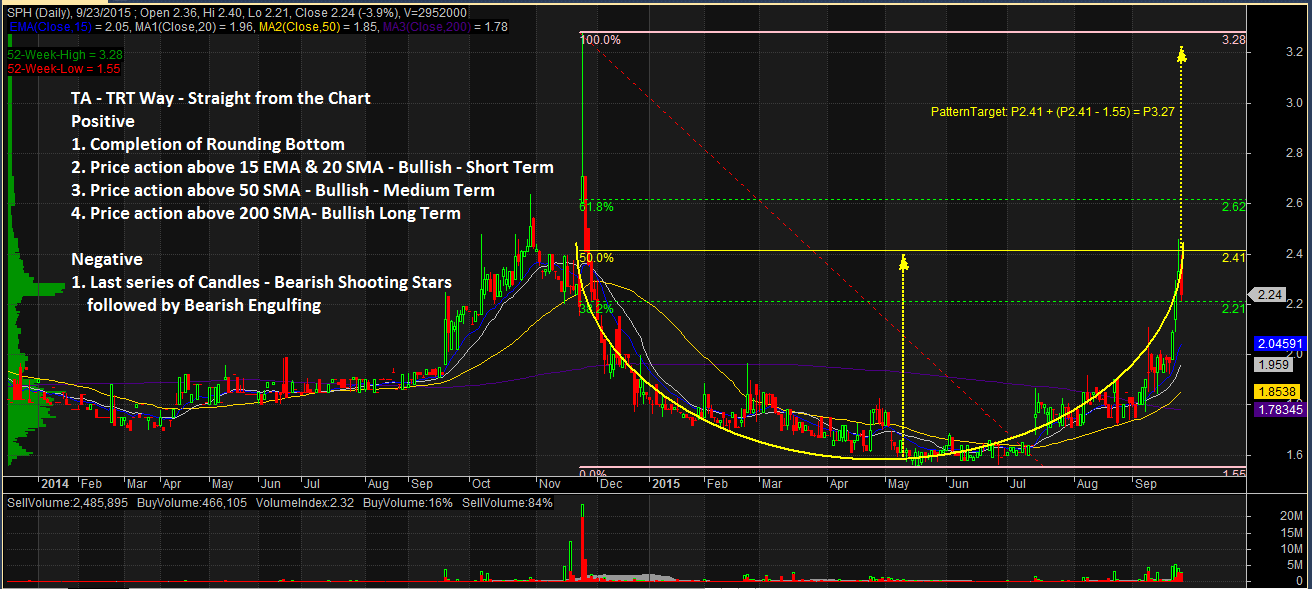
POSITIVE
1. Completion of Rounding Bottom. SPH seems to be in the process of completing a Rounding Bottom Chart Pattern. A break of P2.41 with volume could send the stock to its PatternTarget of P3.27.
2. Price action above 15 EMA and 20 SMA – Bullish – Short Term. Price action above 15 EMA and 20 SMA shows that the stock is Bullish on the Short Term.
3. Price action above 50 SMA – Bullish – Medium Term. Price action above 50 SMA shows that the stock is Bullish on the Medium Term.
4. Price action above 200 SMA – Bullish Long Term. The stock’s price action above 200 SMA confirms that the stock is now in Bull territory.
NEGATIVE
1. Last series of Candles Bearish Shooting Stars followed by Bearish Engulfting. The last series of green candles look like Bearish Shooting Stars and this is followed by a Bearish Engulfing. This could be an indication of weakening of the stock’s momentum and a possible pullback soon.
NOTES:
1. Positive points are things that could work in your favor. Negative points are things that you have to watch out for.
2. On the opposite side of Pattern Targets are Pattern Failures. In case you decide to take this trade, always remember to set a stop loss based on your established risk tolerance level.
3. September is a very significant month for us. It was at the same time this year that we introduced Responsible Trading to mainstream social media. Starting September 1, 2015, since you are already familiar with our caption “TA – The Responsible Trader’s Way – No Hyping, No Bashing, Just Plain Cold Facts” we are changing this to TA – TRT Way – Straight from the Chart.
The Chart and Analysis is presented for educational purposes only and should NEVER BE TAKEN as a RECOMMENDATION to BUY, HOLD, or SELL.
Please trade with CAUTION, please trade with CARE. As always, IT’S YOUR TAKE, IT’S YOUR CALL. IT’S YOUR MONEY AFTER ALL.
Good luck on all your trades.