STOCK CHARTS AND ANALYSIS – TAPET
STOCK CHARTS AND ANALYSIS – TAPET
In accordance with our Independence Day commitment, following is our Technical Analysis of TAPET (TRANS-ASIA PETROLEUM CORP.) as of June 30, 2015.
This is the second of our THREE for FREE for this week.
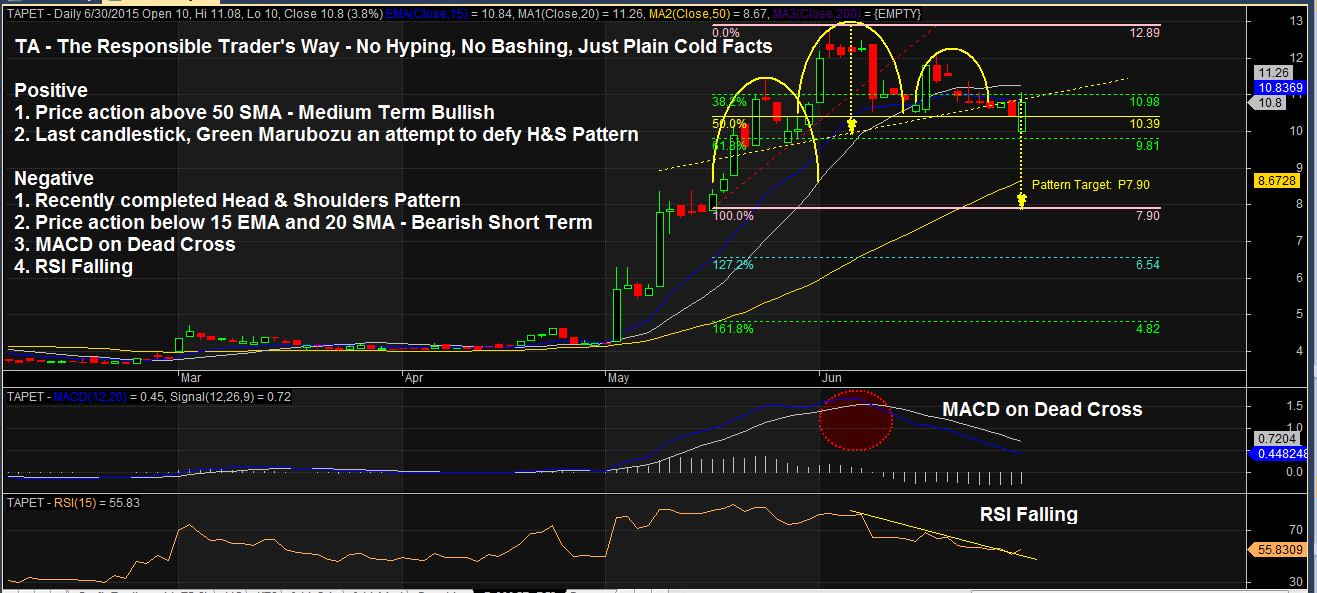
TA – The Responsible Trader’s Way – No Hyping, No Bashing Just Plain Cold Facts.
Positive
1. Price action above 50 SMA. Bullish – Medium Term. TAPET’S current price action is still above 50 SMA showing that the stock is still Bullish on MediumTerm.
2. Last candlestick, green Marubozu is an attempt to defy Head and Shoulders Pattern.
Negative
1. Recently completed a Head and Shoulders Pattern. Failure to stay above P10.98 (38.2% Fibo) could send the stock back to its Pattern Target of P7.90.
2. Recent price action below 15 EMA and 20 SMA. Recent price action below15 EMA and 20 SMA indicates that the stock is Bearish on the Short Term.
3. MACD Dead Cross. During the early part of June 2015, MACD crossed below its signal line showing weakness of the stocks uptrend during that period.
4. RSI Falling. After the MACD made a Dead Cross, the falling RSI confirmed the weakness of the uptrend.
NOTE: Positive points are things that could work in your favor. Negative points are things that you have to watch out for.
The Chart and Analysis is presented for educational purposes only and should NEVER BE TAKEN as a RECOMMENDATION to BUY, HOLD, or SELL.
Please trade with CAUTION, please trade with CARE. As always, IT’S YOUR TAKE, IT’S YOUR CALL. IT’S YOUR MONEY AFTER ALL.
Good luck on all your trades