STOCK CHARTS AND ANALYSIS – TEL
STOCK CHARTS AND ANALYSIS – TEL
Our readers cannot seem to get enough of our THREE for FREE and they want more. The clamor is for more Stock Charts and Analysis of Index stocks, those that we have not covered yet, that they can mix and match with stocks in their portfolios.
We are feeling extra generous this week. Instead of our THREE for FREE we will do a SIX to MIX – Three Index stocks instead of one, and Three Non-Index Stocks instead of two.
In this connection following is our Technical Analysis of TEL (PHIL. LONG DISTANCE TEL. CO. ) as of Sept. 16, 2015.
This is the first of our SIX to MIX for this week.
TA – TRT Way – Straight from the Chart
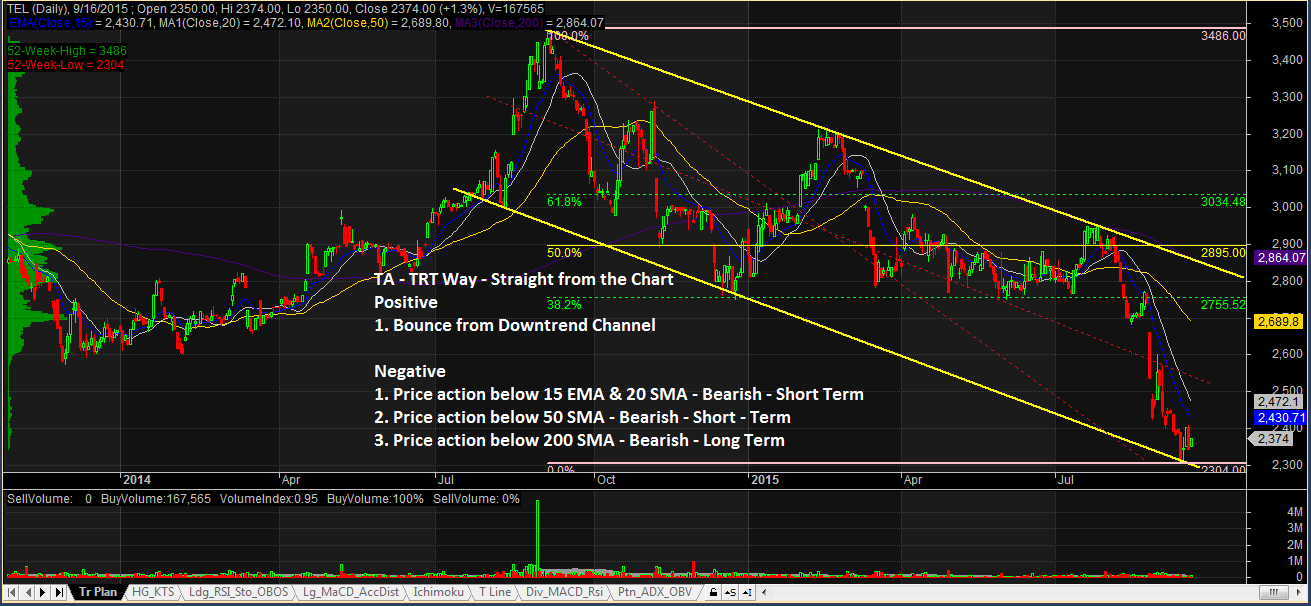
POSITIVE
1. Bounce after hitting 52-week Low. After breaking down from P2755.52 (38.2% Fibo) a very strong support, TEL clearly formed a Downtrend Channel. It appears to be bouncing from the lower end of the Channel this time. It needs to close the gap and go back to its 38.2% Fibo to confirm the bounce.
NEGATIVE
1. Price action below 15 EMA and 20 SMA – Bearish – Short Term. Price action below 15 EMA and 20 SMA shows that the stock is Bearish on the Short Term.
2. Price action below 50 SMA – Bearish – Medium Term. Price action below 50 SMA shows that the stock is Bearish on the Medium Term
3. Price action below 200 SMA – Bearish Long Term. The stock’s price action below 200 after its break down from the Head and Shoulders Pattern also shows that the stock is still in Bear territory.
NOTES:
1. Positive points are things that could work in your favor. Negative points are things that you have to watch out for.
2. On the opposite side of Pattern Targets are Pattern Failures. In case you decide to take this trade, always remember to set a stop loss based on your established risk tolerance level.
3. September is a very significant month for us. It was at the same time this year that we introduced Responsible Trading to mainstream social media. Starting September 1, 2015, since you are already familiar with our caption “TA – The Responsible Trader’s Way – No Hyping, No Bashing, Just Plain Cold Facts” we are changing this to TA – TRT Way – Straight from the Chart.
The Chart and Analysis is presented for educational purposes only and should NEVER BE TAKEN as a RECOMMENDATION to BUY, HOLD, or SELL.
Please trade with CAUTION, please trade with CARE. As always, IT’S YOUR TAKE, IT’S YOUR CALL. IT’S YOUR MONEY AFTER ALL.
Good luck on all your trades.