Stock Charts and Analysis – X
STOCK CHARTS AND ANALYSIS – X (XURPAS, INC.)
In accordance with our Independence Day commitment, following is our Technical Analysis of X as of June 16, 2015.
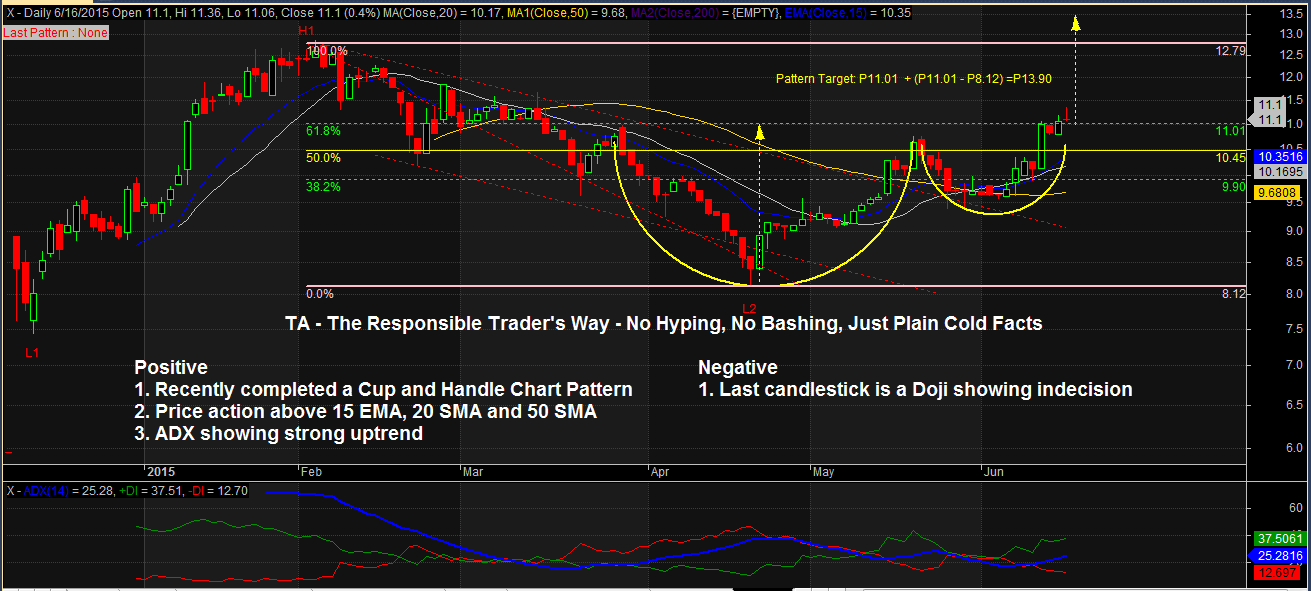
Fig. 1
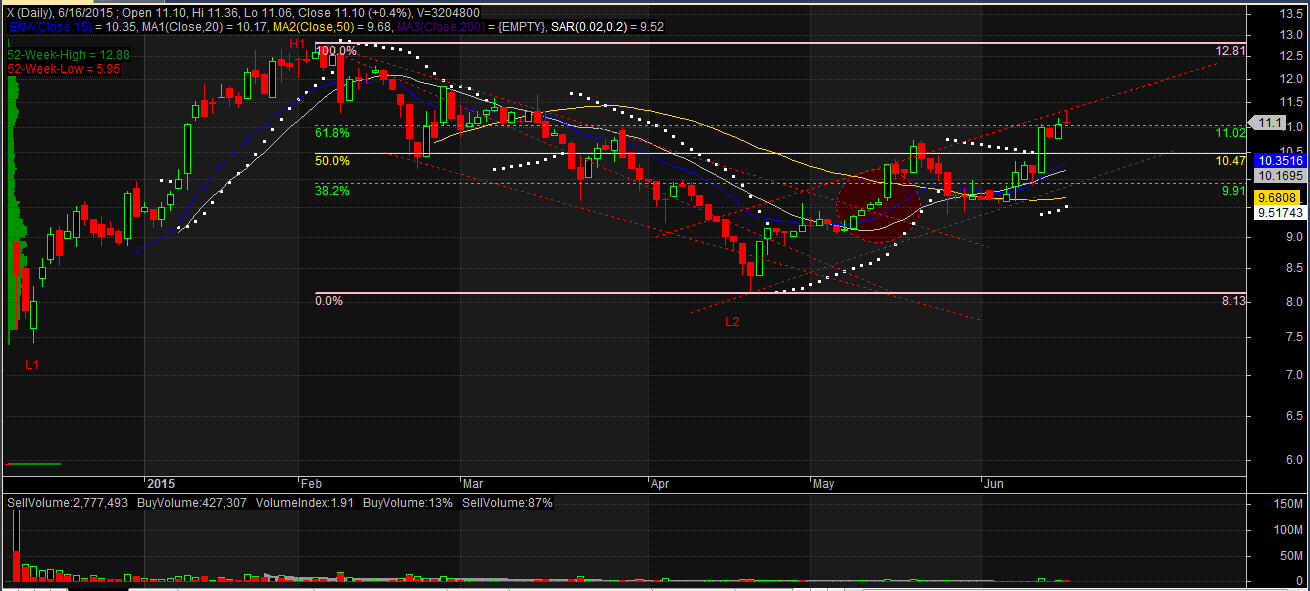
Fig. 2
TA – The Responsible Trader’s Way – No Hyping, No Bashing, Just Plain Cold Facts.
Positive
1. After its Breakout from its downtrend channel (Fig, 2), X has recently completed a Cup and Handle Chart Pattern. A breakout from this pattern will give a Pattern Target of P13.90. (Fig. 1)
2, Price action is now above 15 EMA, 20 SMA (Short Term Trend) and 50 SMA (Medium Term Trend)
3. ADX is showing a strong uptrend with the ADX line (blue line) and the +DI line (green line) pointing upward.
Negative
1. The last candlestick is a Doji showing indecision.
NOTES:
- Positive points are things that could work in your favor. Negative points are things that you have to watch out for.
- On the opposite side of Chart Pattern Targets are Chart Pattern Failures. In case you decide to take this trade, always remember to set a stop loss based on your established risk tolerance level.
The Chart and Analysis is presented for educational purposes only and should NEVER BE TAKEN as a RECOMMENDATION to BUY, HOLD, or SELL.
Please trade with CAUTION, please trade with CARE. As always, IT’S YOUR TAKE, IT’S YOUR CALL. IT’S YOUR MONEY AFTER ALL.
Good luck on all your trades