STOCK CHARTS AND ANALYSIS – X
STOCK CHARTS AND ANALYSIS – X
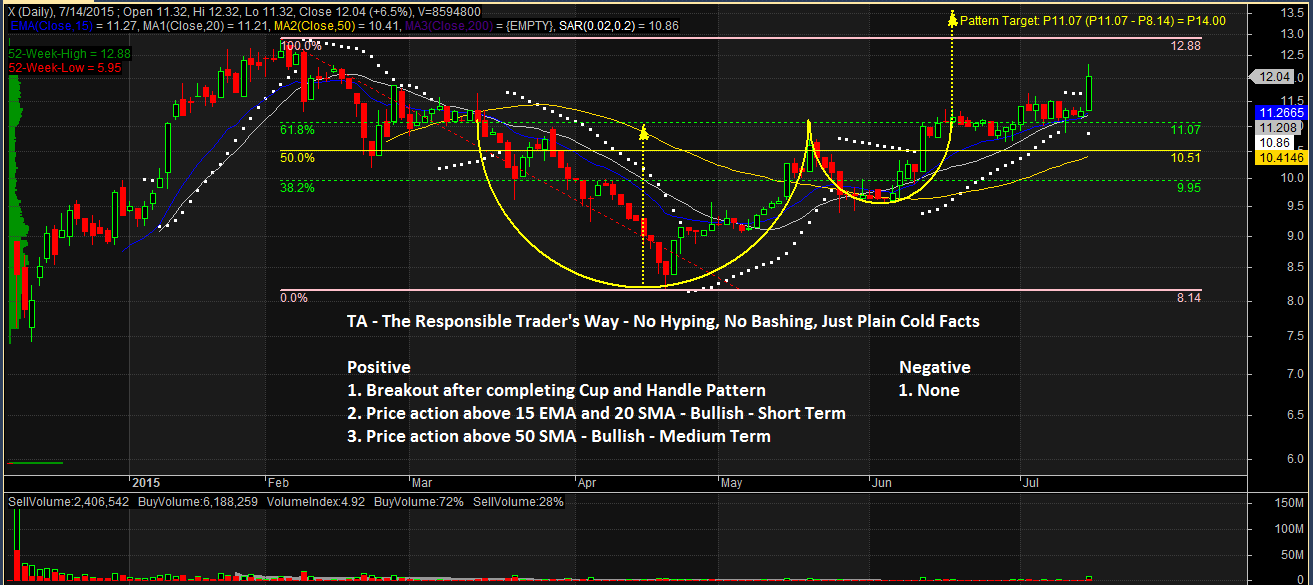
In accordance with our Independence Day commitment, following is our Technical Analysis of X (XURPAS, INC.) as of July 14, 2015. This is an update of our TA last June 16, 2015 where we indicated that X has just completed a Cup and Handle Pattern.
This is the first of our THREE for FREE for this week.
TA – The Responsible Trader’s Way – No Hyping, No Bashing, Just Plain Cold Facts.
Positive
1. Breakout after completing Cup and Handle Pattern. The stock has finally broken out of a Cup and Handle Pattern and now aiming at its Pattern Target. A break of P12.88 (100% Fibo Resistance) could send the stock to its Pattern Target of P14.00
2. Price action above 15 EMA and 20 SMA – Bullish – Short Term. Recent Price action that is now way above 15 EMA and 20 SMA shows that the stock is Bullish on the Short Term.
3. Price action above 50 SMA – Bullish – Medium Term. Recent Price action that is also way above 50 SMA shows that the stock is also Bullish on The Medium Term.
Negative.
1, None. Based on technicals, we do not see anything negative about X at this point in time.
NOTES:
1, Positive points are things that could work in your favor. Negative points are things that you have to watch out for.
2. On the opposite side of Pattern Targets are Pattern Failures. In case you decide to take this trade, always remember to set a stop loss based on your established risk tolerance level.
The Chart and Analysis is presented for educational purposes only and should NEVER BE TAKEN as a RECOMMENDATION to BUY, HOLD, or SELL.
Please trade with CAUTION, please trade with CARE. As always, IT’S YOUR TAKE, IT’S YOUR CALL. IT’S YOUR MONEY AFTER ALL.
Good luck on all your trades.