Stock Charts and Analysis – X
Stock Charts and Analysis – X
Posted in Facebook Trading Groups: June 11, 2015
Some traders asked us: What is our take on X? We gave the following answers. You make your final decision.
TA – The Responsible Trader’s Way – No Hyping, No Bashing, Just Plain Cold Facts.
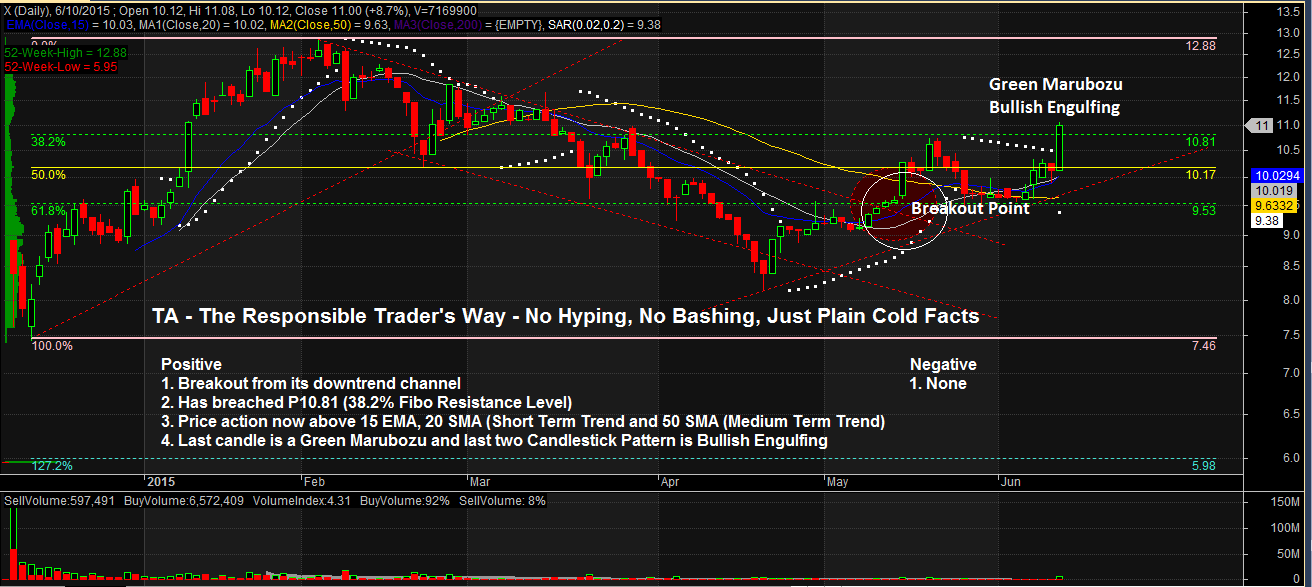
Positive
1. Breakout from its downtrend channel at P9.53 (61.8% Fibo Resistance Level). Breakout Point became Pivot Point and Acted as Support when stock pulled back.
2. Has breached P10.81 (38.2%Fibo Resistance Level). This is significant showing that the new uptrend is strong.
3, Price action is now above 15 EMA, 20 SMA (Short Term Trend) and 50 SMA (Medium Term Trend)
4. Last candle is a Green Marubozu and last two candlestick pattern is Bullish Engulfing.
Negative
1. None. Based on technicals we do not see anything negative about X at this time.
NOTE: Positive points are things that could work in your favor. Negative points are things that you have to watch out for.
The Chart and Analysis is presented for educational purposes only and should NEVER BE TAKEN as a RECOMMENDATION to BUY, HOLD, or SELL.
Please trade with CAUTION, please trade with CARE. As always, IT’S YOUR TAKE, IT’S YOUR CALL. IT’S YOUR MONEY AFTER ALL.
Good luck on all your trades.