TRT ICHI MONICS – THE AB=CD OR THE LIGHTNING BOLT PATTERN
THE AB = CD OR THE LIGHTNING BOLT PATTERN

Harmonics dates back to ancient times and has its roots in Sacred Geometry. Sacred Geometry has been associated with names like Pythagoras and Euclid. The belief in proportion and harmony has been intricately linked throughout history to the Golden Mean. In the realm of mathematics 1.618 is known as the Golden ratio or Phi.
This Golden ratio found full expression in the works of Leonardo Pisano who is famous for the discovery of the Fibonacci numbers which is now a standard part of all trading software packages.
The application of harmonic trading concepts started in the 1930s during the time of W.D. Gann. Gann’s use of geometric proportions based on the circle, square and triangle offered insight into the proper approach required to analyze the market.
The term Harmonic Trading was used by Scott Carney in his first book – The Harmonic Trader. He defined Harmonic Trading as a methodology that utilizes the recognition of specific structures that possess distinct and consecutive Fibonacci ratio alignments that quantify and validate harmonic patterns.
These patterns calculate the Fibonacci aspects of these price structures to identify highly probable reversal points in the financial markets. This methodology assumes that harmonic patterns or cycles. like many patterns and cycles in life, continually repeat. The key is to identify these patterns and enter or exit a position based upon a high degree of probability that the same historic price action will occur.
One of the most important concepts to remember in Harmonic Trading is the Potential Reversal Zone. This is defined as specific price structure that possesses three or more numbers within a defined area used as a basis for defining these harmonic zones.
In essence a PRZ or Potential Reversal Zone represents the critical areas where the flow of buying and selling is potentially changing. These harmonic zones attempt to identify the price levels where imbalanced overbought and oversold situations are reversing – at a minimum back to their respective equilibrium level.
THE AB = CD Pattern
In 1935 H.M Gartley published a book, Profits in the Stock Market, where he described a Chart Pattern that is now called AB = CD.
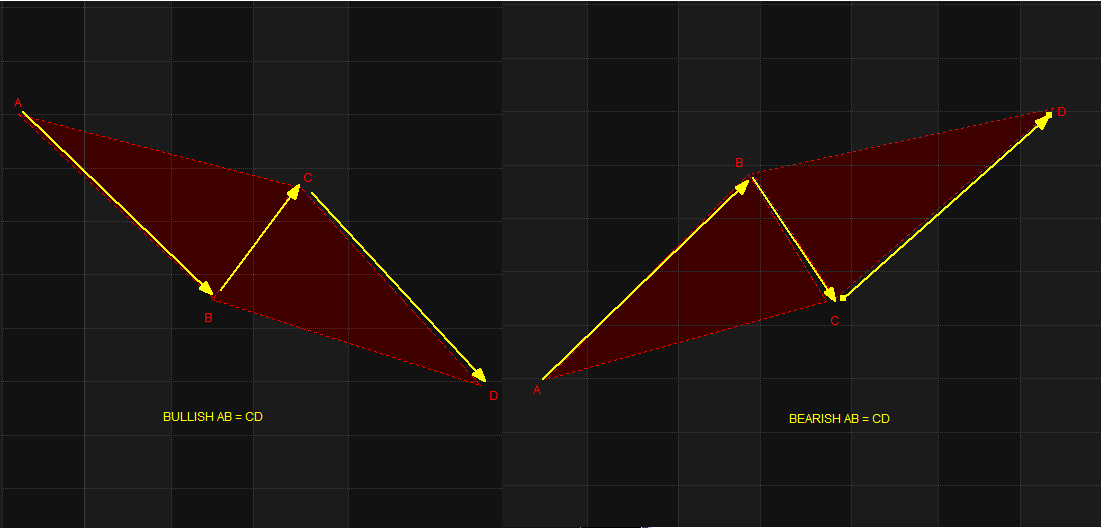
This is the basic pattern in Harmonic Trading. It is also called the lightning bolt pattern since it resembles the same (please see Pattern Outline in Yellow) . It is called Bullish AB = CD Pattern when it is pointing downward and a Bearish AB = CD Pattern when it is pointing upward.
Why Bullish when the Trend is going down? Remember we are talking about Potential Reversal Zone so when it reaches this point there is a probability that it will reverse as an Uptrend and vice versa.
In the AB = CD Pattern we are trying to determine where point D (Potential Reversal Zone) will be. In a Bullish AB = CD , Line AB representing the AB leg of the triangle ABC is the selldown and the BC leg is the retracement. The reciprocal ratio of the C point retracement of the AB leg of the triangle usually indicates which BC projection is utilized to define point D or the Potential Reversal Zone.
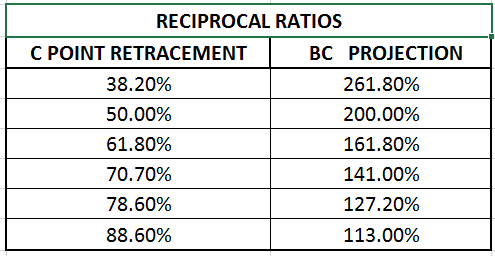
The reciprocal ratios that complement the AB = CD structure are as follows:
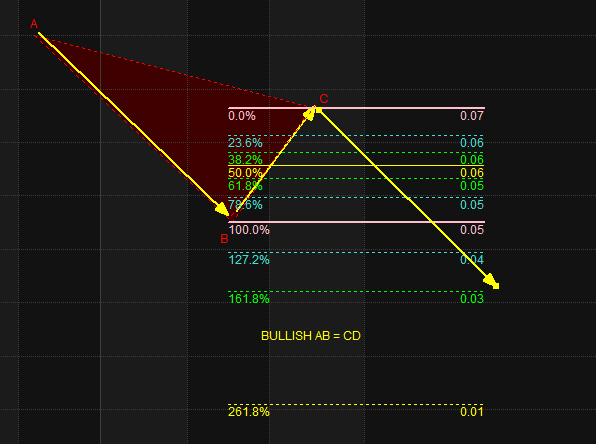
In the AB = CD Pattern, we follow a certain procedure. Fibonacci Retracement then Projection using Fibonacci Extension. Using A as starting point we draw a Fibonacci gridline ending at point B. We can see that Point C falls exactly at 61.8% Retracement.
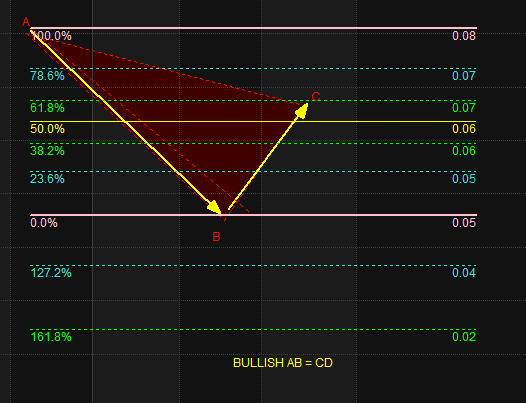
With the 61.8% Retracement at point C, we do a BC Projection and draw a Fibonacci extension to find point D. (Please see our Lesson in Fibonacci Extension). You will recall that in doing Fibonacci Extension we have three points. 1. The Point of Origin. 2. The Point of Projection and 3. The Point of Termination. In Harmonic Trading the Point of Origin, in this case, Point C , is the same as the Point of Termination.
We can see three possible extensions: 127.2%, 161.8% and 261.8%. From the above table of Fibonacci reciprocal ratios we take 161.8% as our BC projection.
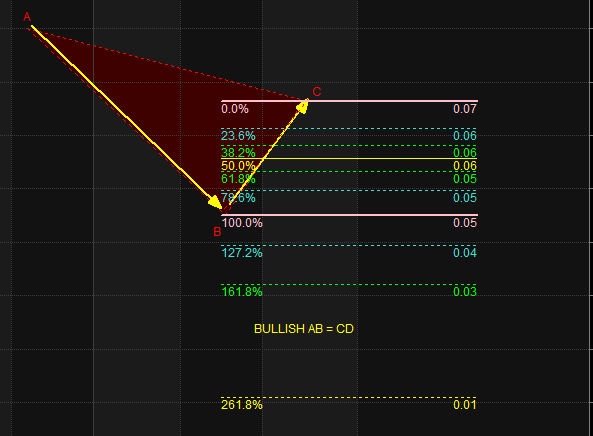
We now draw an arrow and indicate where point D lies.
Since we now have all the points in our AB = CD Pattern we can already draw the boundaries of the other triangle.
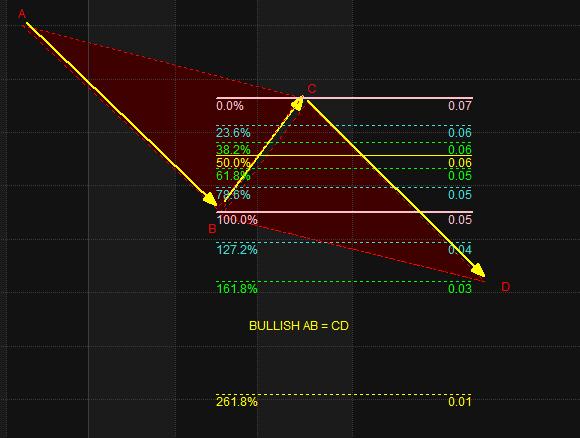
Our task does not end here. In order to make the Pattern useful to us, we have to draw a final Fibonacci gridline to determine our Critical Action Zones – Buy Zone, Take Profit Zone and Cut Loss Zone. To do this we draw the Fibonacci Gridline from Point A to Point D.

We usually have our Buy Zone from 23.6% to 0.0%. Take Profit Zone 1 from 38.2% to 50% and Take Profit Zone 2 from 61.8% to 78.6%.
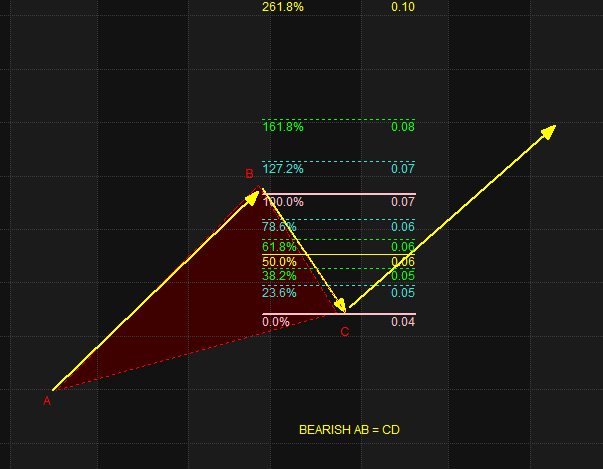
BEARISH AB = CD
For a Bearish AB = CD. We follow the same procedure. Using A as starting point we draw a Fibonacci gridline ending at point B. We can see that Point C falls exactly at 61.8%Retracement.
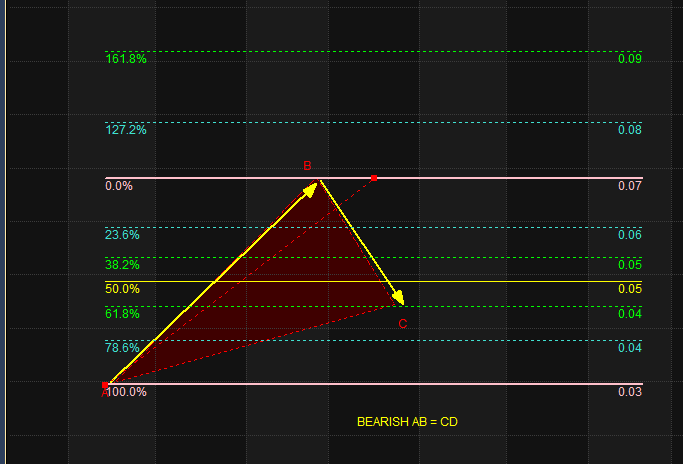
Using the 61.8% Retracement, we use BC Extension to find point D. For our Fibonacci extension we use point C as our Point of Origin and Point of Termination. We can see three possible extensions: 127.2%, 161.8% and 261.8%. From the above table of Fibonacci reciprocal ratios we take 161.8% as our BC projection.
We now draw an arrow and indicate where point D lies.
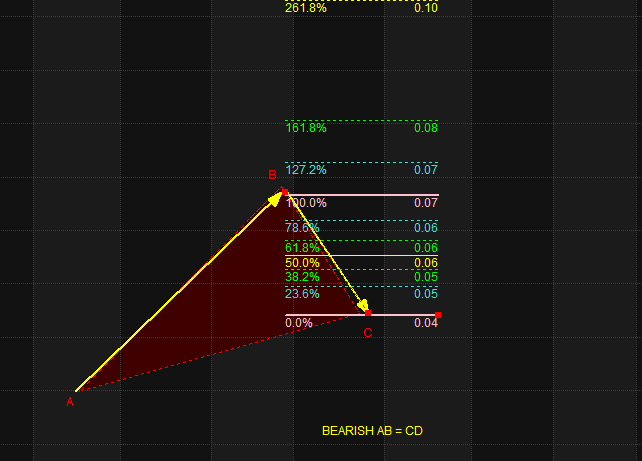
Since we now have all the points in our AB = CD Pattern we can already draw the boundaries of the other triangle.
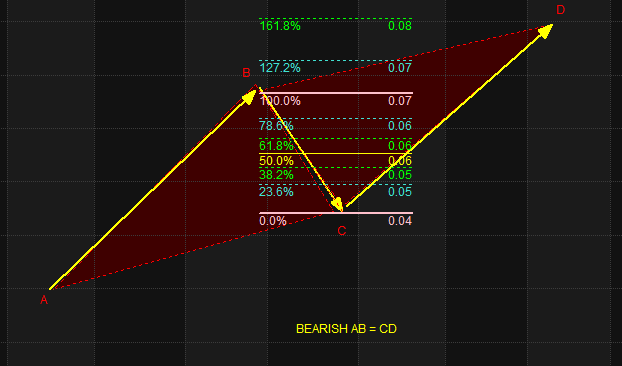
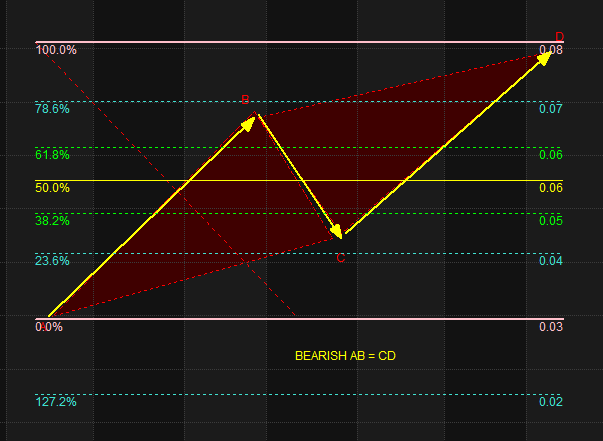
Just like in our Bullish AB = CD example in order to make the Pattern useful to us, we have to draw a final Fibonacci gridline to determine our Critical Action Zones – Buy Zone, Take Profit Zone and Cut Loss Zone. To do this we draw the Fibonacci Gridline from point D to point A.
STAIR-STEPPING
Last week, we got comments like “Ang baba naman ng Buy Zone. Hindi nga tayo maiipit kasi hindi naman tayo makakabili.” We will now address those issues here. It was premature to address those questions without first presenting our lesson this week. Otherwise it would have led to more confusion than clarity.
You can see that it takes some time before you can complete drawing a Harmonic Pattern. It is not as easy as drawing Trendlines, Support and Resistance.
After identifying and drawing a Pattern, I would like to make it as my basis for my trading decisions. Unless there are changes in the Pattern Structure leading to another Pattern I would like to keep it intact.
In Responsible Trading particularly when we are using the Ichi-Monics System, I have developed a concept which I call Stair-Stepping.
Since Harmonics has already defined the Trading Parameters for us, we can use this concept to our advantage both in Bullish and Bearish Patterns.
As long as we have a Strong Buy Signal, a Tenkan Cross above the Kumo or Cloud we can apply this concept. In Stair-Stepping like climbing a flight of Stairs, we can raise our Buy Zone from 23.6% to 38.2% and adjust our take Profit Zones and Cut Loss Zones respectively. We can keep on doing so as long as the Strong Buy Signal remains intact.
As an illustration let us take AGI as an example. Since AGI has a Tenkan Cross above the Kumo we can now do one Stair-Step, raising our Buy Zone to 13.41 up to 14.05 and adjust our Take Profit Zone 1 to 14.57 up to 15.08 and Take Profit Zone 2 to 15.82 up to 16.76 and also raise our Cut Loss Zone to 13.40 up to 13.00.
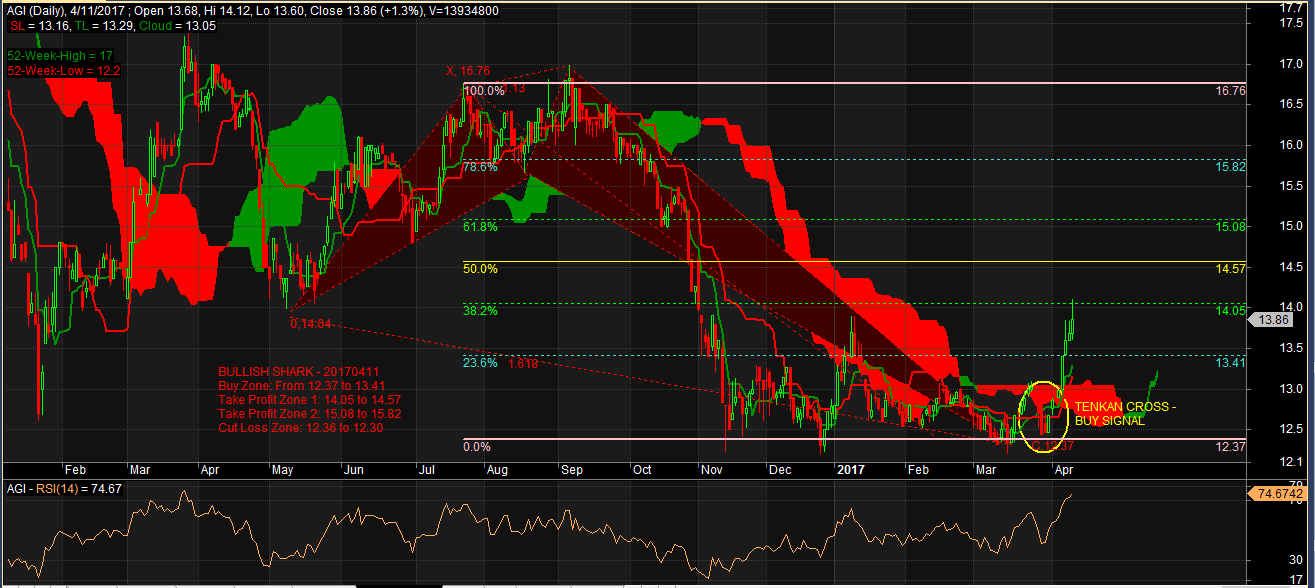
Please take note that I will not adjust the Critical Action Zones as indicated on the Chart to avoid confusion. I leave it up to you to make the adjustments when you do the Stair-Stepping so that we will all have a common reference point. I will post updates on the Chart if there are developments. I will only post a new Chart once a new Pattern has emerged.
“TRT Ichi-Monics – The Trading Signals of Ichi Moku Kinko Hyo and the Trading Parameters of Harmonics”
NOTE: This is a trading lesson previously posted in my BooKAKA Premium. Subscribers get these lessons weekly. It is posted here so that BooKAKA Premium Subscribers can review them again and for others to see what they are missing from my posts in my BooKAKA Premium.
Next Lesson: The GARTLEY PATTERN