TRT ICHI MONICS – THE BUTTERFLY PATTERN
THE BUTTERFLY PATTERN
NOTE: Images taken from the books on Harmonic Trading by Scott Carney
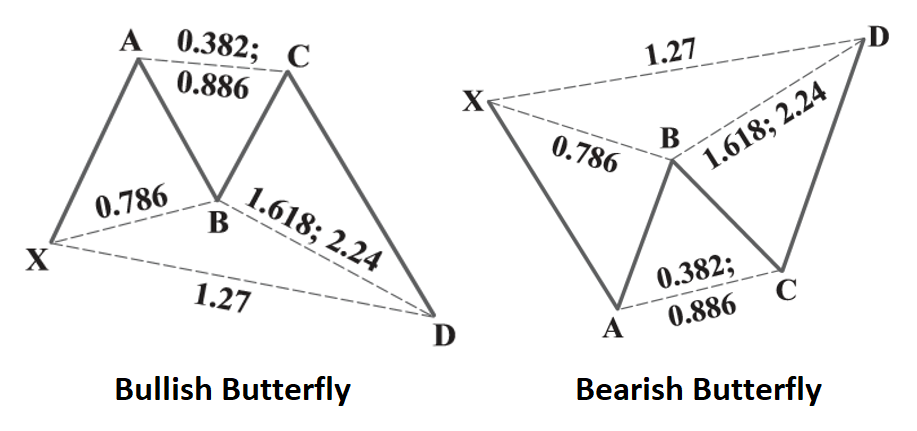
The Butterfly Pattern is very different from all the Patterns we have studied so far because of its B Point Retracement of 78.6% more than the Bat’s 38.2% and the Gartley’s 61.8%.
Let us take a look at the features of the Butterfly Pattern:
a. Retracement of the B point at exact 78.6%.
b. Retracement of the C point within a range of 38.2% to 88.6%
c. BC projection of 161.8% to 224.0%
d. Constraint of 127.2% % Extension of the XA leg.
a. Retracement of the B point at exact 78.6%.
b. Retracement of the C point within a range of 38.2% to 88.6%
c. BC projection of 161.8% to 224.0%
d. Constraint of 127.2% % Extension of the XA leg.
Let us draw the Pattern using the following procedures:
1. Draw a Fibonacci Retracement Grid starting from point X to point A to get where point B retraced. In this case it is exactly 78.6.%.
1. Draw a Fibonacci Retracement Grid starting from point X to point A to get where point B retraced. In this case it is exactly 78.6.%.
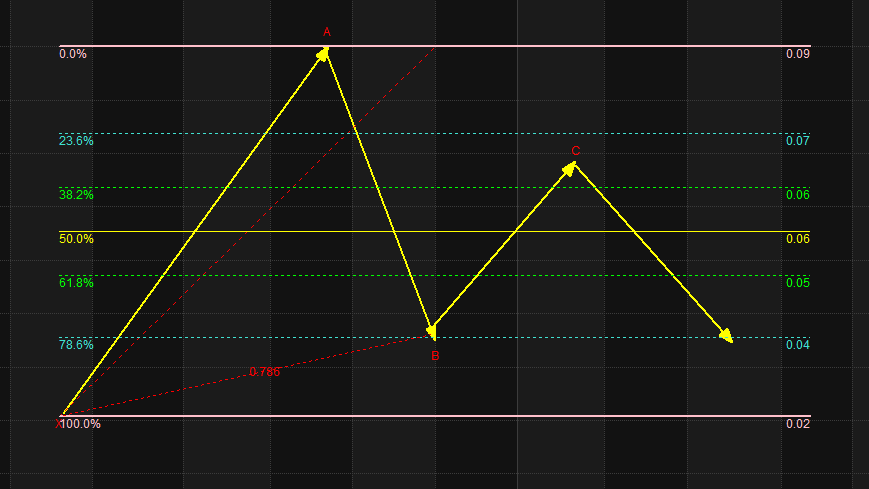
2. Draw a Fibonacci Retracement Grid starting from point A to point B to get where point C retraced. In this case it is 61.8%.%
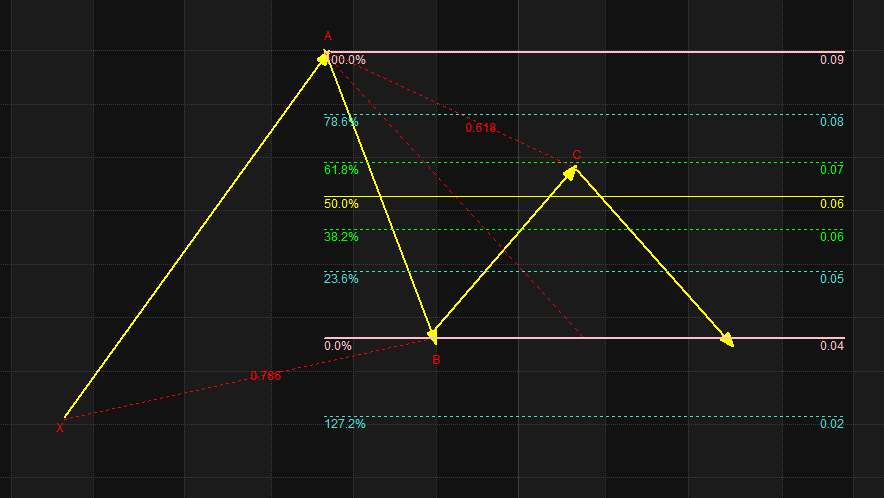
3. Project BC by drawing a Fibonacci Extension from C to B using C as Point of Origin and Point of Termination. From the Butterfly Pattern image this should be a range from 161.8% to 224.0%. Let us take 161.8% which is at 0.02 and mark it as our tentative point D or PRZ.
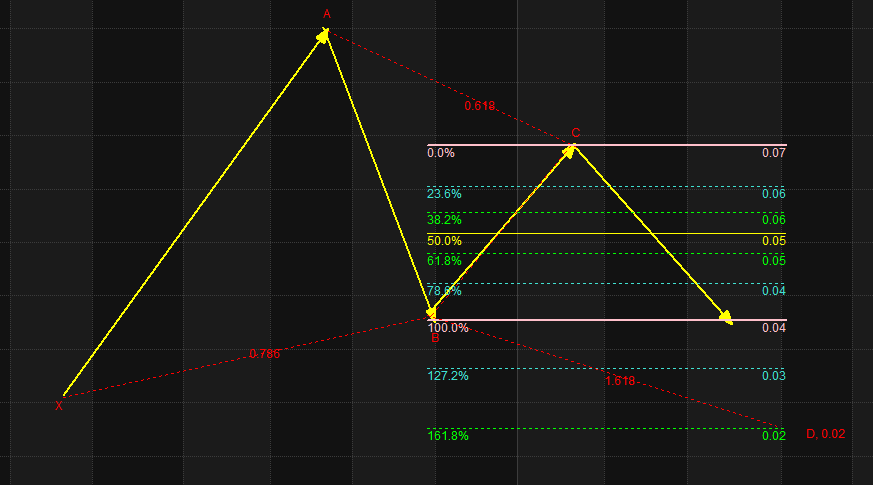
4. The next step is to draw the Constraint which is an 127.2.% Extension of the XA leg. We see that this 127.2.% Extension falls at 0.00 lower than our tentative D of 0.02 .In cases like this the tentative D becomes the minimum PRZ and the Constraint at 127.2..0% becomes the Maximum PRZ. To avoid confusion, we mark the maximum PRZ as D1 and the minimum PRZ as D2.
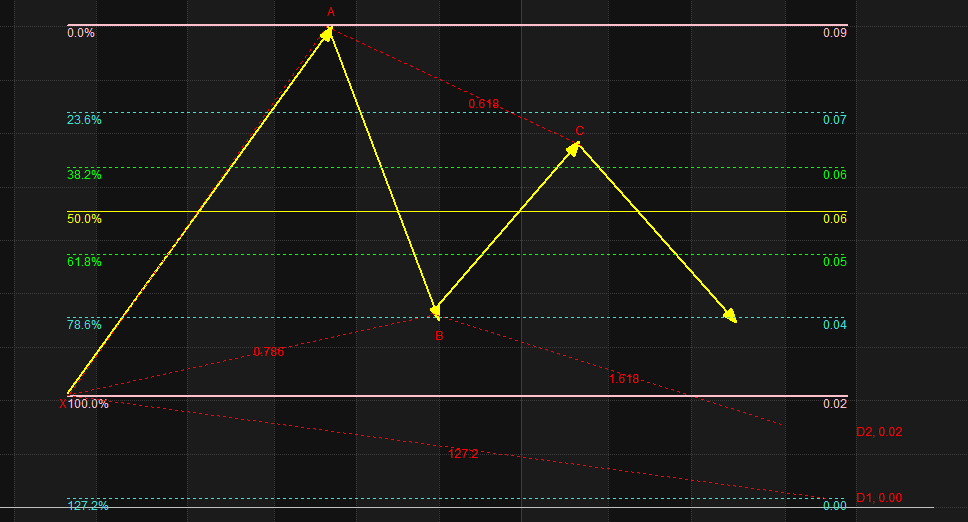
5. This figure shows the Pattern with the corresponding Fibonacci measurements.
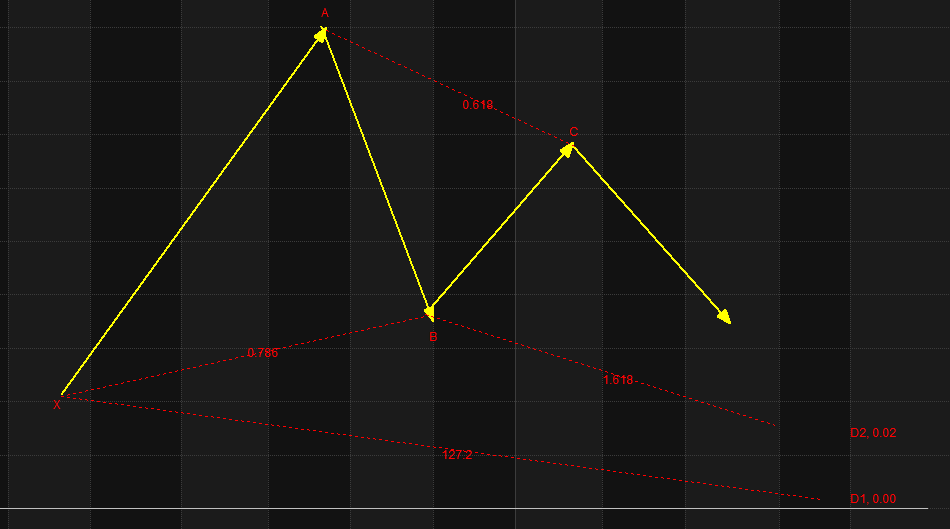
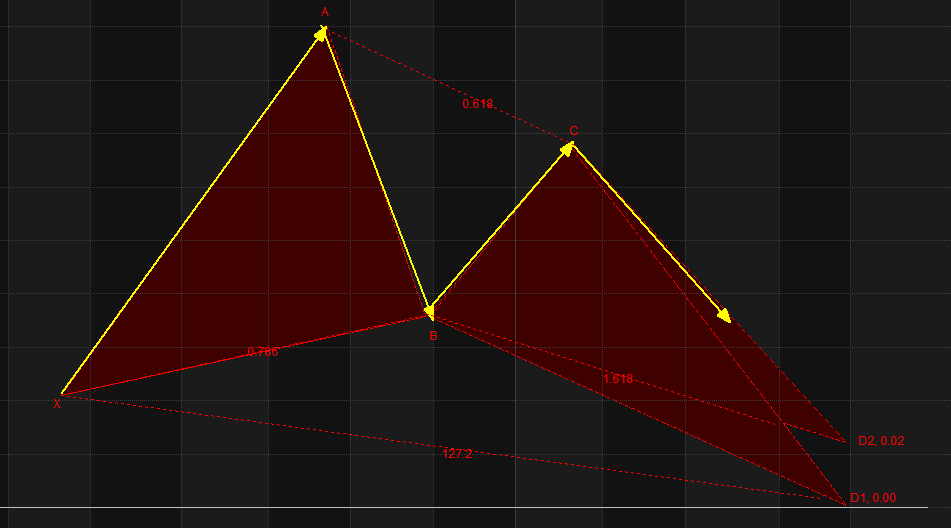
6. We now draw the Pattern by connecting the points of the two Triangles. In TRT Ich-Monics, we take the Constraint as the Final Determinant of the D Point but we also take note of the D2 in case the stock makes a reversal on this point. This is the complete Bullish Butterfly Pattern.
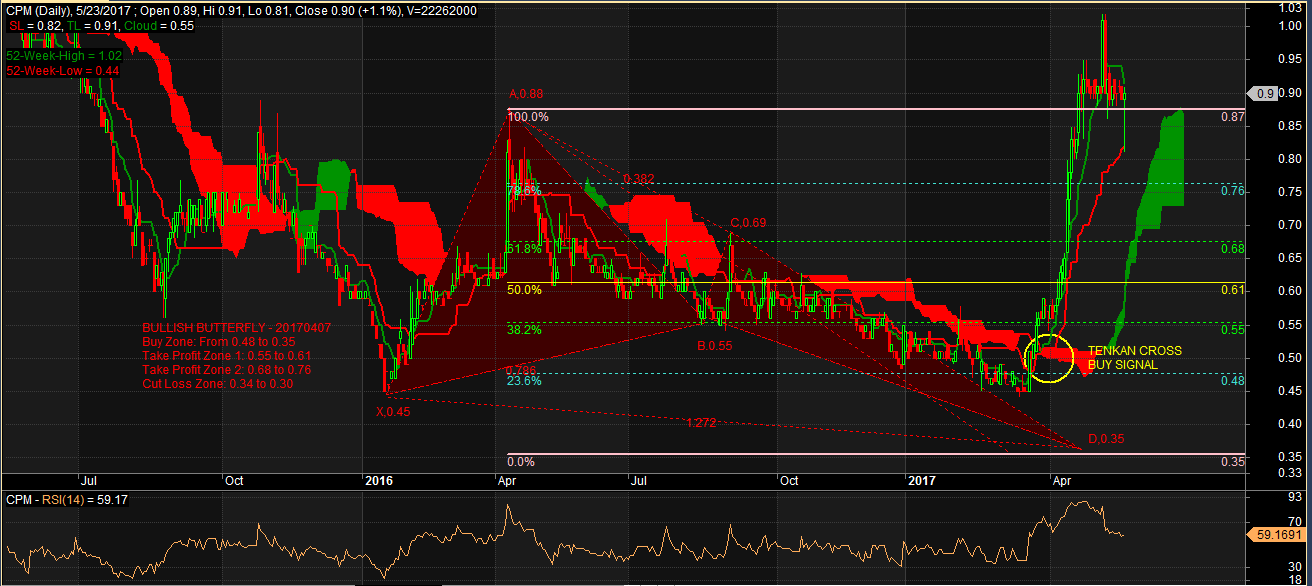
7. Just like in our last lesson, to make the pattern useful, we have to draw a final Fibonacci Retracement Gridline starting from Point A to Point D to establish our TRT Critical Action Zones.

8. To better appreciate the Pattern, I would like us to take a look at some examples.
This is CPM with a Bullish Butterfly Pattern.
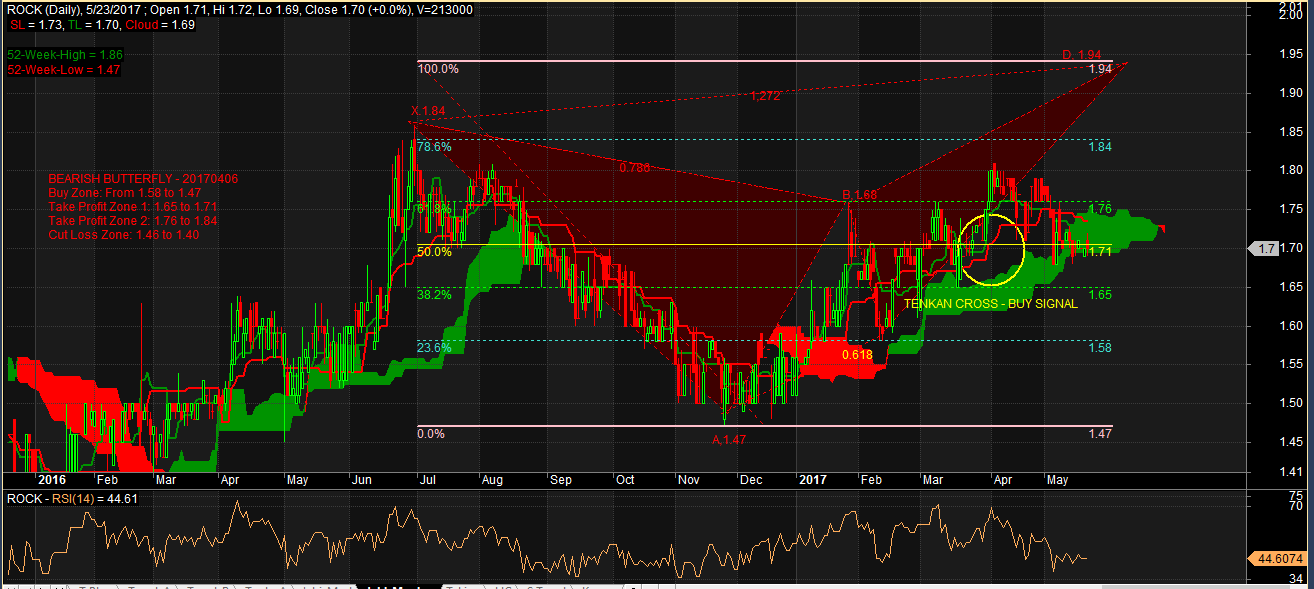
This is ROCK with Bearish Butterfly Pattern.
NOTE: Sometimes some figures appear as decimals. At other times they appear as percentages. To convert decimals to percentage just move the decimal point two places to the right. For example 1.618 is expressed in percentage as 161.8%.
Next Lesson: THE PERFECT BUTTERFLY PATTERN
“TRT Ichi-Monics – The Trading Signals of Ichi Moku Kinko Hyo and the Trading Parameters of Harmonics”
NOTE: This is a trading lesson previously posted in my BooKAKA Premium. Subscribers get these lessons weekly. It is posted here so that BooKAKA Premium Subscribers can review them again and for others to see what they are missing from my posts in my BooKAKA Premium.